. 2008 Jul;83(1):77-88.
doi: 10.1016/j.ajhg.2008.06.018.

Influence of Friedreich ataxia GAA noncoding repeat expansions on pre-mRNA processing

Affiliations

Influence of Friedreich ataxia GAA noncoding repeat expansions on pre-mRNA processing

Marco Baralle et al. Am J Hum Genet. 2008 Jul.

Abstract

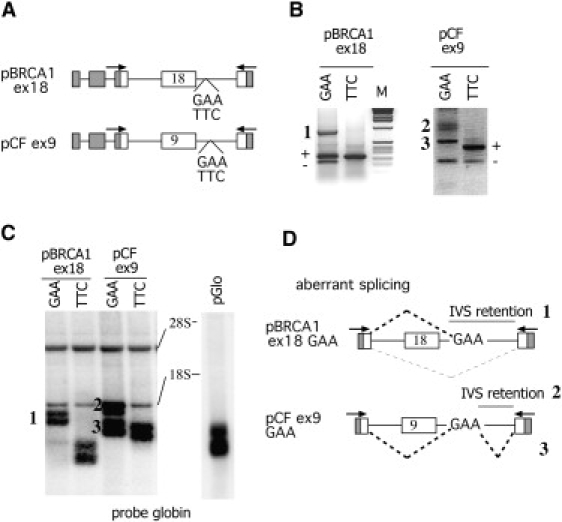
The intronic GAA repeat expansion in the frataxin (FXN) gene causes the hereditary neurodegenerative disorder Friedreich ataxia. Although it is generally believed that GAA repeats block transcription elongation, direct proof in eukaryotic systems is lacking. We tested in hybrid minigenes the effect of GAA and TTC repeats on nascent transcription and pre-mRNA processing. Unexpectedly, disease-causing GAA(100) repeats did not affect transcriptional elongation in a nuclear HeLa Run On assay, nor did they affect pre-mRNA transcript abundance. However, they did result in a complex defect in pre-mRNA processing. The insertion of GAA but not TTC repeats downstream of reporter exons resulted in their partial or complete exclusion from the mature mRNAs and in the generation of a variety of aberrant splicing products. This effect of GAA repeats was observed to be position and context dependent; their insertion at different distances from the reporter exons had a variable effect on splice-site selection. In addition, GAA repeats bind to a multitude of different splicing factors and induced the accumulation of an upstream pre-mRNA splicing intermediate, which is not turned over into mature mRNA. When embedded in the homologous frataxin minigene system, the GAA repeats did not affect the pre-mRNA transcript abundance but did significantly reduce the splicing efficiency of the first intron. These data indicate an association between GAA noncoding repeats and aberrant pre-mRNA processing because binding of transcribed GAA repeats to a multitude of trans-acting splicing factors can interfere with normal turnover of intronic RNA and thus lead to its degradation and a lower abundance of mature mRNA.


Figures

Figure 1
Figure 1
Expanded GAA- and TTC-Triplet Repeats Did Not Affect the Levels of Nascent Transcription (A) Schematic representation of pEDA minigenes. Gray and white boxes correspond to α-globin and fibronectin exonic sequences, respectively; lines indicate intronic sequences. The position of the GAA and TTC repeats is indicated. The position of the u1, d1, and d2 nascent-transcript amplification products is indicated. The length and position of the M13 antisense Nuclear Run On probes relative to the minigenes are shown. (B) Typical NRO analysis of HeLa cells. Cells were transfected with one of the indicated minigenes together with the cotransfection control VA construct. M13 corresponds to the empty M13 vector. Antisense single-strand M13 probes (A to F and VA) are indicated at the top. (C) The graph shows the VA-normalized quantitation of three independent transfections relative to the values obtained with the pEDA (black columns) constructs over the corresponding probes. Data are expressed as means + SD. Light-gray and white columns show transcription levels obtained with pEDA NcoGAA and pEDA NcoTTC minigenes. All signals are corrected for the background hybridization shown in the M13-negative control. (D) Analysis of pre-mRNA transcript abundance. The indicated minigenes were transfected in COS cells, and the resulting RNAs were coamplified with the u1-d1 (top) or u1-d2 (bottom) primer set and resolved on agarose gels. The pEDA without repeats is indicated with Ø. Controls without reverse transcriptase (RT) and untransfected cells (C) are indicated. M is the molecular 1 Kb marker.
Figure 2
Figure 2
Effect of GAA and TTC Repeats on Pre-mRNA Splicing in pEDA Hybrid Minigenes (A) Schematic representation of pEDA minigenes. Gray and white boxes correspond to α-globin and fibronectin exonic sequences, respectively, and lines indicate intronic sequences. The position and cloning sites of the GAA and TTC repeats (n = 100) are indicated. Arrows represent the primers used in amplification experiments. (B) Schematic representation of the aberrant splicing product in pEDA NcoGAA and pEDA NdeGAA minigenes as derived from PCR and Northern analysis. Dotted lines indicate the aberrant splicing choices, and gray lines indicate the intron (IVS) retentions. (C) RT-PCR analysis. Minigenes were transfected in COS cells, and the splicing pattern was evaluated with α2-3 and EDA5 primers. Aberrant splicing forms in pEDA NcoGAA and pEDA NdeGAA are numbered. (D) Northern analysis. Minigenes were transfected in COS cells, and the resulting RNA was analyzed by Northern blotting with an α-globin (upper) or fibronectin EDA (lower) probes. Control Δ2e and Δ4 are EDA minigene mutants that showed complete exon skipping and inclusion, respectively. Ribosomal RNAs and the two alternative spliced forms with and without the EDA exon are indicated. Aberrant splicing forms in pEDA NcoI GAA and pEDA NdeI GAA are numbered.
Figure 3
Figure 3
The Number of GAA Repeats Affects the Severity of the Aberrant Splicing Pattern (A) Northern analysis of pEDA Nde minigenes with 100 or 15 GAA or TTC repeats. Minigenes were transfected in COS cells, and the resulting RNA was analyzed by Northern blotting with an α-globin probe. Ribosomal RNAs and the two alternative spliced forms with and without the EDA exon are indicated. Aberrant splicing forms in pEDA Nde GAA100 and pEDA NdeI GAA15 are numbered. (B) Schematic representation of the splicing products observed in in pEDA Nde GAA100 and pEDA NdeI GAA15 as deduced from Northern analysis and the sequencing of aberrant products in RT-PCR analysis. Dotted lines indicate the aberrant splicing choices, and gray lines indicate the intron (IVS) retentions.
Figure 4
Figure 4
Effect of GAA-TTC Repeats in BRCA1 Exon 18 and CFTR Exon 9 (A) Schematic representation of minigenes containing the GAA or TTC (n = 100) repeats. Gray boxes correspond to α-globin sequence, and white boxes correspond to BRCA1 and CFTR exons. Lines indicate intronic sequences. Arrows represent the primers used in amplification experiments. (B) RT-PCR analysis. Minigenes were transfected in COS cells, and the splicing pattern was evaluated with specific primers. Exon inclusion (+) and exclusion (-) as well as aberrant splicing (numbers) are indicated. (C) Northern analysis. Minigenes were transfected in COS cells, and the resulting RNA was analyzed by Northern blotting with an α-globin probe. The basic pGlo minigene that contains the α-globin sequences with a short endogenous promoter showed a double band, which is due to alternative transcript initiation. Ribosomal RNAs are indicated. Aberrant splicing forms in pBRCA1ex18 GAA and pCFex9 GAA are numbered. (D) Schematic representation of the aberrant splicing products observed in pBRCA1ex18 GAA and pCFex9 GAA. Dotted lines indicate the aberrant splicing choices, and gray lines indicate the intron (IVS) retentions.
Figure 5
Figure 5
Turnover of Pre-mRNA Intermediates in pEDA Nco Minigenes (A) Schematic representation of the hybrid minigenes used for evaluation of the splicing intermediates. The gray box corresponds to a hybrid α-globin fibronectin exon that is partially skipped in the upstream intermediates, and the black box is the 40 bp insertion in pEDA BglII. The indicated primer pairs α936--EDA1251R and EDA1207D-glo395 amplify, relative to the EDA exon, the upstream and downstream intermediates, respectively. (B) Analysis of downstream intermediates. pEDA NcoGAA and pEDA NcoTTC minigenes were transfected in COS cells, and pre-mRNA was amplified with EDA1207D and glo395. The splicing product is shown, and its identity was verified by direct sequencing. (C) Analysis and relative quantitation of upstream intermediates. Cotransfection experiments and RT-PCR amplification with α936 and EDA1251R are shown. Equal amounts of pEDA NcoGAA and pEDA NcoTTC (250 ng) were transfected in COS cells alone or in combination with different amounts of pEDA BglII (250 ng in lanes 3–5; 1 μg in lane 6; and 2 μg in lane 7). The major upstream intermediates originating from pEDA NcoGAA and pEDA NcoTTC (iUP) or from pEDA BglII (iUP Bg) are indicated.
Figure 6
Figure 6
Binding Properties of the GAA and UUC RNAs Immunoblot after pull-down analysis of (GAA)10 and (UUC)10 ribo-oligonucleotide sequences. Synthetic RNA oligonucleotides, (GAA)10 and (UUC)10, were used as targets for pull-down assays. The affinity-purified proteins pulled down by the RNAs were resolved on an SDS-PAGE and analyzed by immunoblotting with anti-PTB, anti-PABPN1, anti-hnRNPA1/A2, anti-ZNF9, anti-SF2/ASF, anti-SR proteins, and anti-Tra2β antibodies. The identity of the splicing factors is indicated. HeLa nuclear extract (NE) was used as a control.
Figure 7
Figure 7
Effect of GAA-TTC Repeats on Pre-mRNA Splicing in the Homologous Frataxin Minigene (A) Schematic representation of the frataxin minigene containing the GAA or TTC (n = 100) repeats and showing the unspliced (U, D, and D1) and spliced (S) amplification products. (B) Analysis of splicing efficiency. The pFrx minigenes were transfected in COS cells, and RT-PCR analysis was performed so that the S- and U-unspliced transcripts (upper gel) or the S- and D-unspliced transcripts (lower gel) could be detected. The identity of the spliced and unspliced bands is indicated, and the number below each lane is the mean of the spliced versus unspliced ratio from four independent experiments. Controls without reverse transcriptase (RT) are indicated. M is the molecular 1 Kb marker. (C) The pFrx minigenes were transfected in COS cells, and coamplification with U and D1 primer sets was performed so that pre-mRNA transcript abundance could be detected. (D) The ratios between the various spliced (S) and unspliced (D and U) forms and between the unpliced D1 and U are expressed as means + SD of four independent transfection experiments.

References

    1. Pandolfo M. The molecular basis of Friedreich ataxia. Adv. Exp. Med. Biol. 2002;516:99–118. - PubMed
    1. Harding A.E. Friedreich's ataxia: A clinical and genetic study of 90 families with an analysis of early diagnostic criteria and intrafamilial clustering of clinical features. Brain. 1981;104:589–620. - PubMed
    1. Pandolfo M., Koenig M. Friedreich's ataxia. In: Wells R.D., Warren S.T., editors. Genetic Instabilities and Hereditary Neuromuscular Diseases. Academic Press; San Diego, CA: 1998. pp. 373–398.
    1. Campuzano V., Montermini L., Molto M.D., Pianese L., Cossee M., Cavalcanti F., Monros E., Rodius F., Duclos F., Monticelli A. Friedreich's ataxia: Autosomal recessive disease caused by an intronic GAA triplet repeat expansion. Science. 1996;271:1423–1427. - PubMed
    1. Clark R.M., Dalgliesh G.L., Endres D., Gomez M., Taylor J., Bidichandani S.I. Expansion of GAA triplet repeats in the human genome: Unique origin of the FRDA mutation at the center of an Alu. Genomics. 2004;83:373–383. - PubMed

Publication types