

Revealing the architecture of gene regulation: the promise of eQTL studies
- PMID: 18597885
- PMCID: PMC2583071
- DOI: 10.1016/j.tig.2008.06.001
Revealing the architecture of gene regulation: the promise of eQTL studies
Abstract
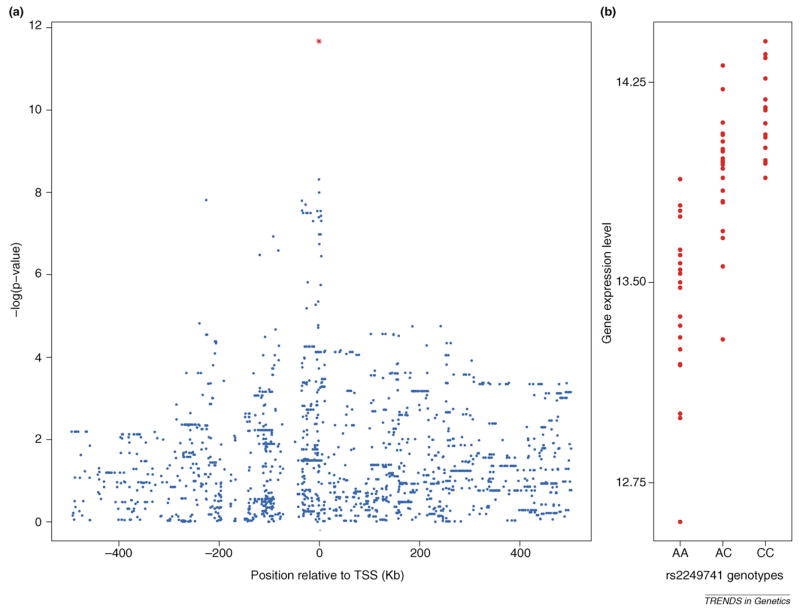
Expression quantitative trait loci (eQTL) mapping studies have become a widely used tool for identifying genetic variants that affect gene regulation. In these studies, expression levels are viewed as quantitative traits, and gene expression phenotypes are mapped to particular genomic loci by combining studies of variation in gene expression patterns with genome-wide genotyping. Results from recent eQTL mapping studies have revealed substantial heritable variation in gene expression within and between populations. In many cases, genetic factors that influence gene expression levels can be mapped to proximal (putatively cis) eQTLs and, less often, to distal (putatively trans) eQTLs. Beyond providing great insight into the biology of gene regulation, a combination of eQTL studies with results from traditional linkage or association studies of human disease may help predict a specific regulatory role for polymorphic sites previously associated with disease.
Figures
References
-
- Oleksiak MF, et al. Variation in gene expression within and among natural populations. Nat Genet. 2002;32:261–266. - PubMed
-
- Gilad Y, et al. Natural selection on gene expression. Trends Genet. 2006;22:456–461. - PubMed
-
- Genissel A, et al. Cis and Trans Regulatory effects contribute to natural variation in transcriptome of Drosophila. Mol Biol Evol. 2008;25:101–110. - PubMed
-
- Abzhanov A, et al. Bmp4 and morphological variation of beaks in Darwin’s finches. Science. 2004;305:1462–1465. - PubMed
-
- McGregor AP, et al. Morphological evolution through multiple cis-regulatory mutations at a single gene. Nature. 2007;448:587–590. - PubMed
Publication types
MeSH terms
Grants and funding
LinkOut - more resources
Full Text Sources
Other Literature Sources
Molecular Biology Databases
