Logarithm of the absolute correlations of the ECG waveform estimates duration of ventricular fibrillation and predicts successful defibrillation
- PMID: 18597916
- PMCID: PMC2561072
- DOI: 10.1016/j.resuscitation.2008.04.009
Logarithm of the absolute correlations of the ECG waveform estimates duration of ventricular fibrillation and predicts successful defibrillation
Abstract
Background: Measures of the ventricular fibrillation (VF) waveform may enable better allocation of cardiac arrest treatment by discriminating which patients should receive immediate defibrillation versus alternate therapies such as CPR. We derive a new measure based on the 'roughness' of the VF waveform, the Logarithm of the Absolute Correlations (LAC), and assess and contrast how well the LAC and the previously published scaling exponent (ScE) predict the duration of VF and the likelihood of return of spontaneous circulation (ROSC) under both optimal experimental and commercial-defibrillator sampling conditions.
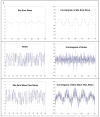
Methods and results: We derived the LAC and ScE from two different populations--an animal study of 44 swine and a retrospective human sample of 158 out-of-hospital VF arrests treated with a commercial defibrillator. In the animal study, the LAC and ScE were calculated on 5s epochs of VF recorded at 1000 samples/s and then down sampled to 125 samples/s. In the human study, the LAC and ScE were calculated using 6s epochs recorded at 200 samples/s that occurred immediately prior to the initial shock. We compared the LAC and ScE measures using the Spearman correlation coefficients (CC) and areas under the receiver operating characteristic curve (AUC).
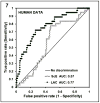
Results: In the animal study, the LAC and ScE were highly correlated at 1000 sample/s (CC=0.93) but not at 125 samples/s (CC=-0.06). These correlations were reflected in how well the measures discriminated VF of < or =5 versus >5 min: AUC at 1000 samples/s was similar for LAC compared to ScE (0.71 versus 0.76). However AUC at 125 samples was greater for LAC compared to ScE (0.75 versus 0.62). In the human study, the LAC measure was a better predictor of ROSC following initial defibrillation as reflected by an AUC of 0.77 for LAC compared to 0.57 for ScE.
Conclusions: The LAC is an improvement over the ScE because the LAC retains its prognostic characteristics at lower ECG sampling rates typical of current clinical defibrillators. Hence, the LAC may have a role in better allocating treatment in resuscitation of VF cardiac arrest.
Conflict of interest statement
Figures


References
-
- Cobb LA, Fahrenbruch C, Walsh T, Copass M, Olsufka M, Breskin M, Hallstrom A. Influence of cardiopulmonary resuscitation prior to defibrillation in patients with out-of-hospital ventricular fibrillation. JAMA. 1999;281(13):1182–8. - PubMed
-
- Wik L, Hansen TB, Fylling F, Steen T, Vaagnes P, Auestad BH, Steen PA. Delaying defibrillation to give basic cardiopulmonary resuscitation to patients with out-of-hospital ventricular fibrillation. JAMA. 2003;289(11):1389–95. - PubMed
-
- Vilke GM, Chan TC, Dunford JV, Metz M, Ochs G, Smith A, Fisher R, et al. The three-phase model of cardiac arrest as applied to ventricular fibrillation in a large, urban emergency medical services system. Resuscitation. 2004;64:341–346. - PubMed
-
- Callaway CW, Menegazzi JJ. Waveform analysis of ventricular fibrillation to predict defibrillation. Current Opinion in Critical Care. 2005;11:192–199. - PubMed
-
- Dzwonczyk R, Brown CG, Werman HA. The median frequency of the ECG during ventricular fibrillation: its use in an algorithm for estimating the duration of cardiac arrest. IEEE Trans Biomed Eng. 1990;37:640–6. - PubMed
MeSH terms
Grants and funding
LinkOut - more resources
Full Text Sources
Medical

