. 2008 Jul 3:9:60.
doi: 10.1186/1471-2202-9-60.

Synchrony between orientation-selective neurons is modulated during adaptation-induced plasticity in cat visual cortex

Affiliations

Synchrony between orientation-selective neurons is modulated during adaptation-induced plasticity in cat visual cortex

Narcis Ghisovan et al. BMC Neurosci. .

Abstract

Background: Visual neurons respond essentially to luminance variations occurring within their receptive fields. In primary visual cortex, each neuron is a filter for stimulus features such as orientation, motion direction and velocity, with the appropriate combination of features eliciting maximal firing rate. Temporal correlation of spike trains was proposed as a potential code for linking the neuronal responses evoked by various features of a same object. In the present study, synchrony strength was measured between cells following an adaptation protocol (prolonged exposure to a non-preferred stimulus) which induce plasticity of neurons' orientation preference.

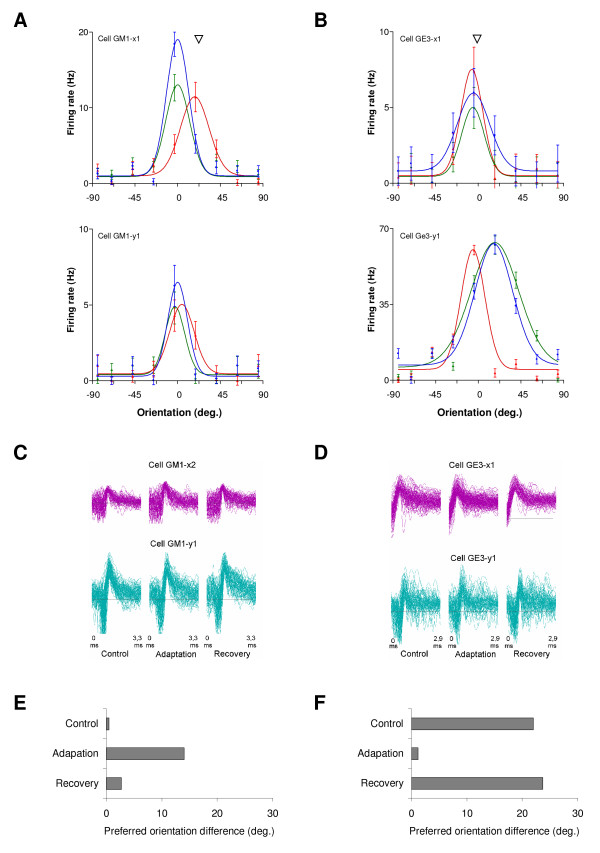
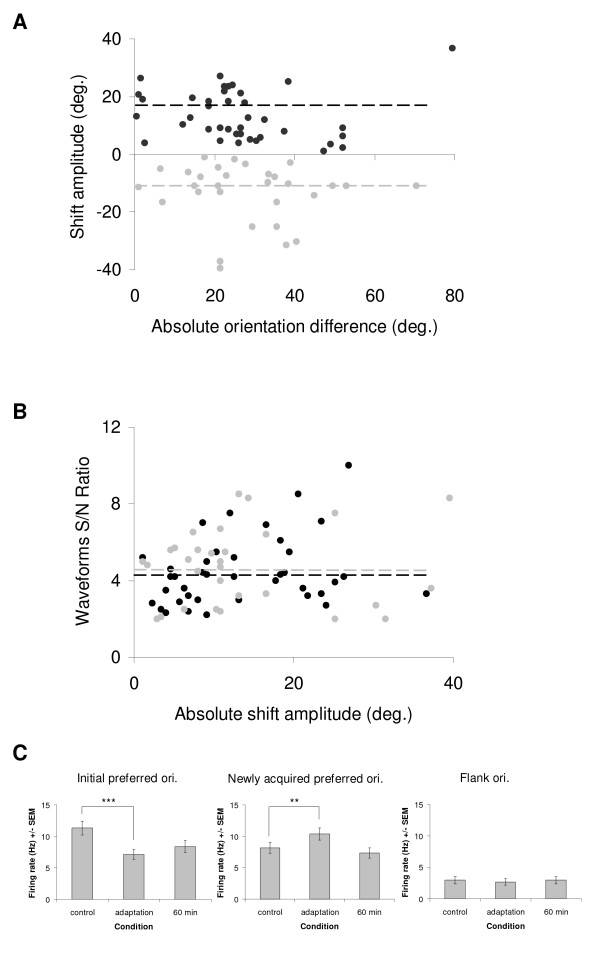
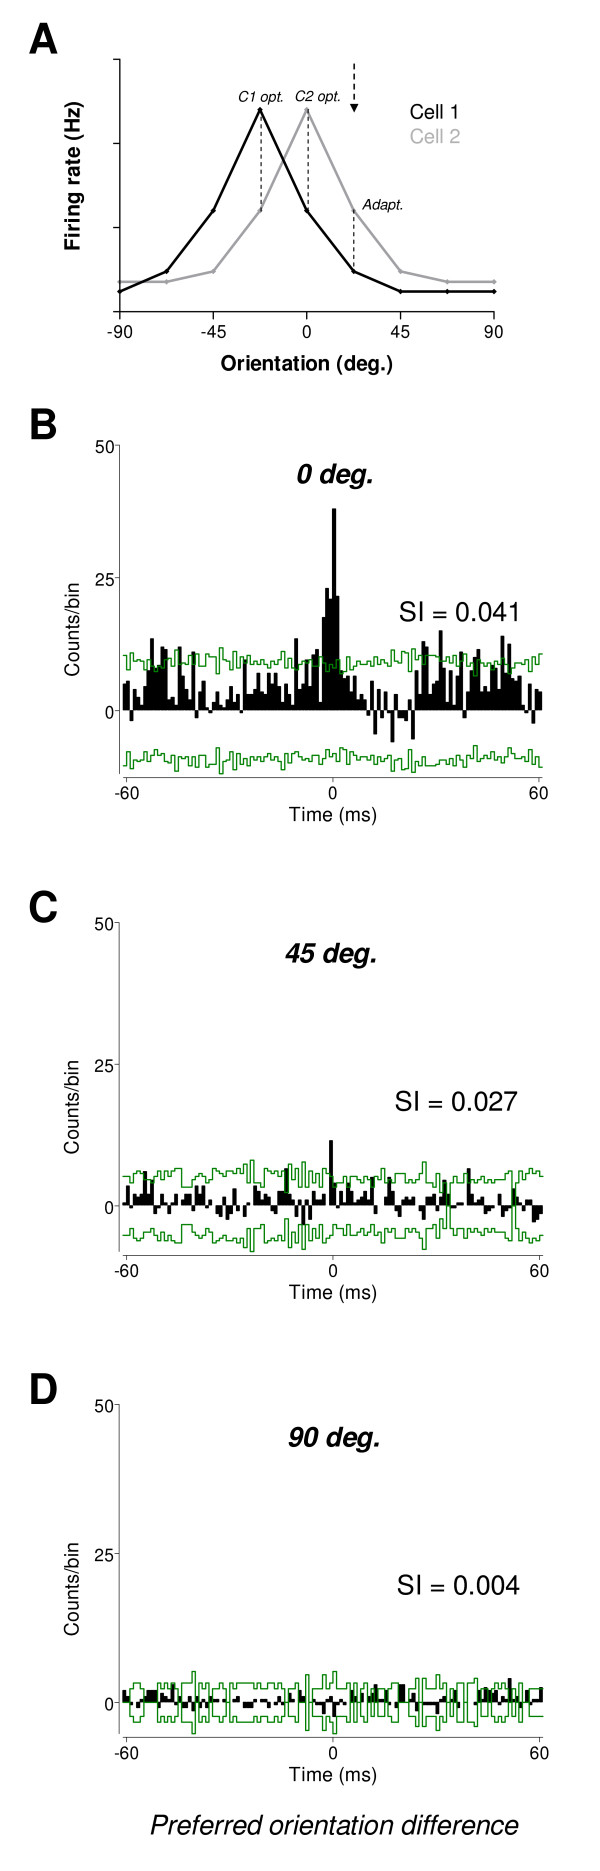
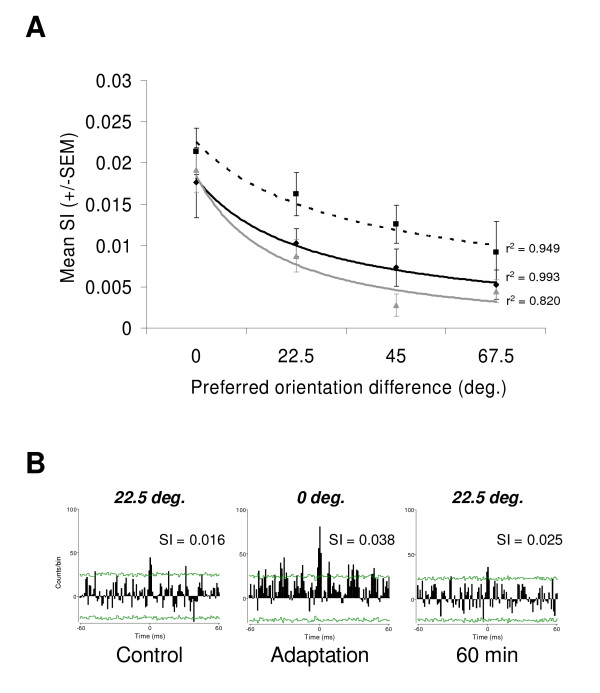
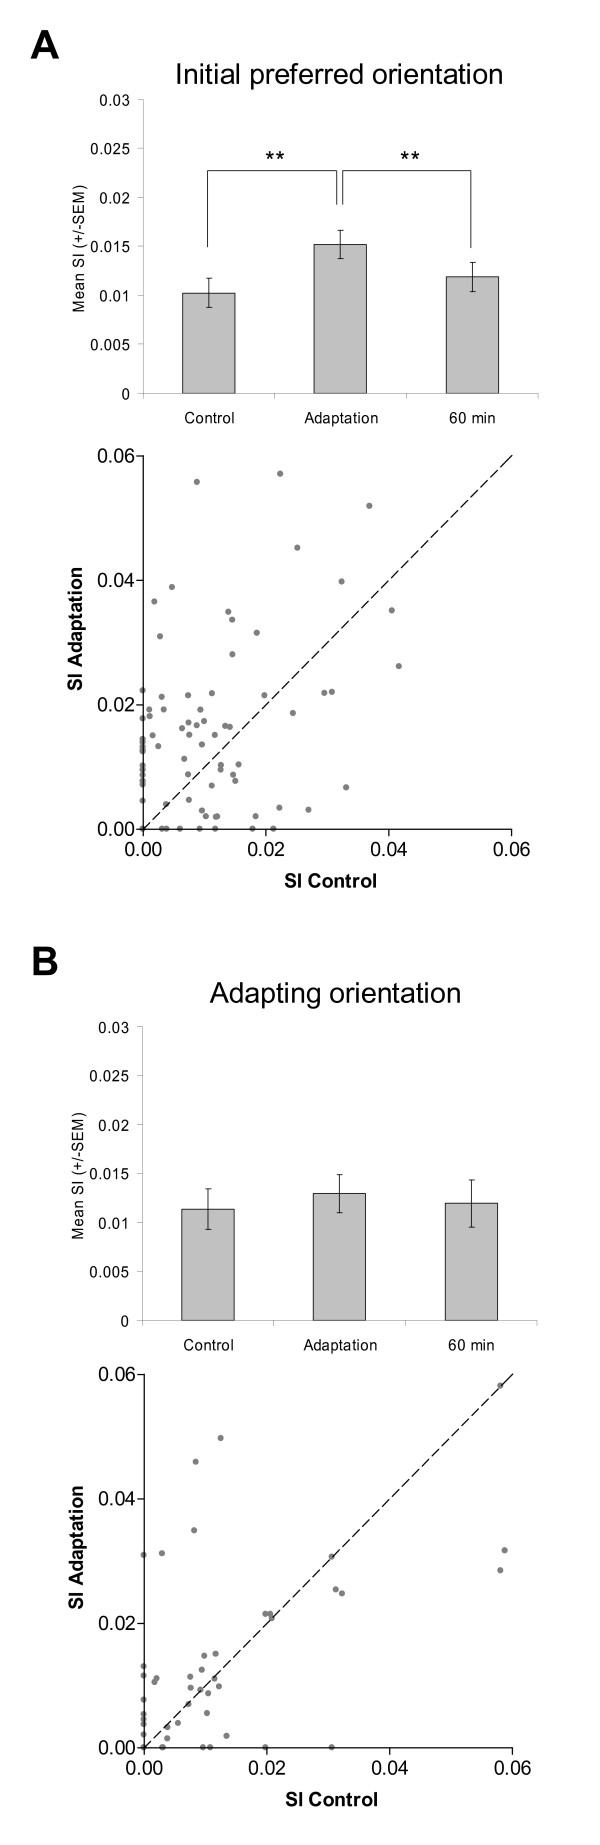
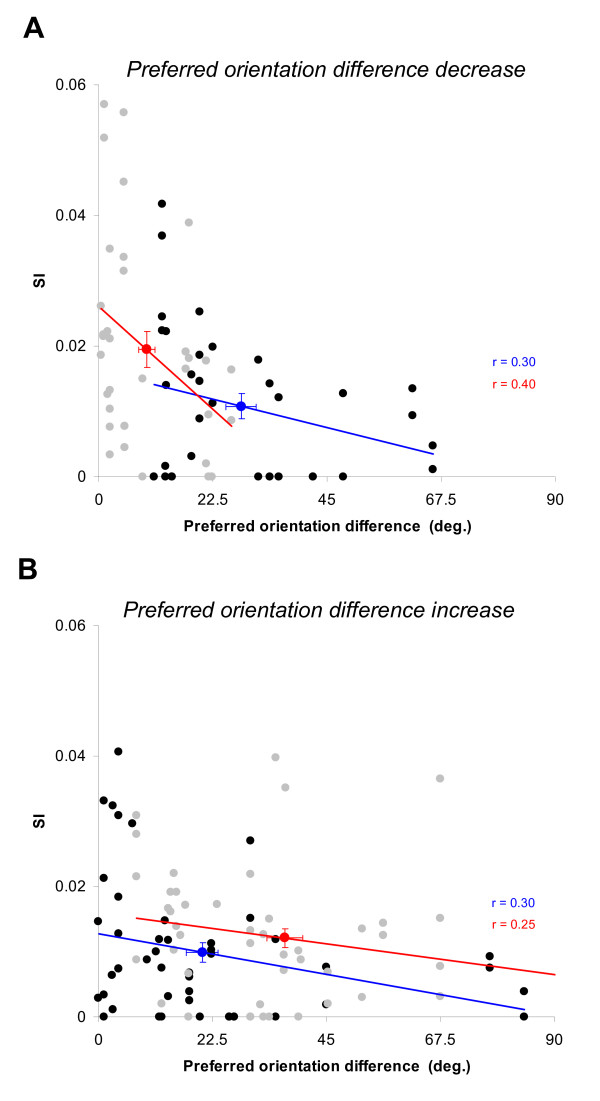
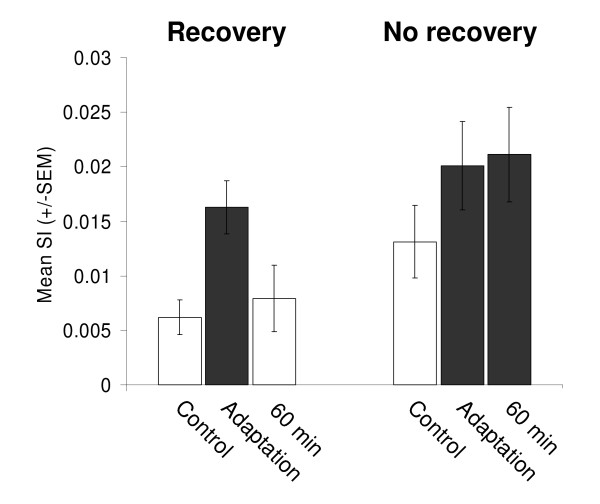
Results: Multi-unit activity from area 17 of anesthetized adult cats was recorded. Single cells were sorted out and (1) orientation tuning curves were measured before and following 12 min adaptation and 60 min after adaptation (2) pairwise synchrony was measured by an index that was normalized in relation to the cells' firing rate. We first observed that the prolonged presentation of a non-preferred stimulus produces attractive (58%) and repulsive (42%) shifts of cell's tuning curves. It follows that the adaptation-induced plasticity leads to changes in preferred orientation difference, i.e. increase or decrease in tuning properties between neurons. We report here that, after adaptation, the neuron pairs that shared closer tuning properties display a significant increase of synchronization. Recovery from adaptation was accompanied by a return to the initial synchrony level.

Conclusion: We conclude that synchrony reflects the similarity in neurons' response properties, and varies accordingly when these properties change.


Figures

Figure 1
Figure 1
Adaptation-induced plasticity of orientation tuning in two V1 neuron pairs. Orientation tuning curves of neuron pairs responding to drifting gratings were recorded in area 17. Curves were centered in relation to the preferred orientation of one cell of the pair in the control condition. Spontaneous activity was subtracted. Arrows indicate the adapting orientation that was presented continuously for 12 minutes. Inter-electrode distance was 400 microns for both pairs. Color code – blue: control, red: adaptation, green: 60 minutes later (error bars denote SEM). (A) Example of an adaptation-induced shift of 18.5° to the right for the cell GM1-x1 and a small shift of 4.5° in the same direction for the other cell GM1-y1. (B) Another example of a 21.9° shift to the left for the cell GE3-y1, but only a very small effect of 1.7° for the other cell of the pair, GE3-x1. (C and D) Respective waveforms for the 2 neuron pairs presented in A and B. The waveforms are similar across conditions, indicating the stability of a cell's activity and discrimination. The S/N ratios were 3.2 and 4.0 for neurons presented in C while S/N ratios of neurons in D were 3.1 and 2.6, respectively. (E and F) The absolute difference of preferred orientation between cells across experimental conditions (A: increase from 0° to 14° after adaptation; B: decrease from 22° to 1.2°). The original preferred orientation difference recovered within 60 min.
Figure 2
Figure 2
Adaptation-induced plasticity of orientation tuning in a population of 72 neurons. (A) Scatter plot showing the amplitude of shifts in preferred orientation after adaptation as a function of the absolute difference between the control preferred orientation and the adapting orientation. Positive values (black dots) designate attractive shifts (n = 42) and negative values (grey dots) designate repulsive shifts (n = 30). The dashed lines in black and grey indicate the mean amplitude for attractive (17.3°) and repulsive (13.5°) shifts, respectively. (B) Scatter plot displaying the signal-to-noise (S/N) ratio of neuronal spikes' waveforms in the control condition as a function of the absolute shift amplitude (black dots indicate attractive shifts, whereas grey dots indicate repulsive shifts). Data are equally distributed around the S/N ratio mean values for both attractive (black dashed line) and repulsive shifts (grey dashed line). This distribution shows that shifts in orientation preference are unrelated to the S/N ratio (r < 0.1 regardless the direction of the shift). (C) Histograms showing the modulation of mean firing rate between control, adaptation and 60 minutes after adaptation conditions (error bars are SEM). Left: following the adaptation, a significant decrease of the firing rate is observed for the initial preferred orientation; paired sample two-tailed t-test, p < 0.001. Middle: in parallel, a significant increase of the response is observed for the newly acquired preferred orientation (attractive and repulsive shifts pooled together); paired sample two-tailed t-test, p < 0.01. Right: there are no significant changes in the response of far flank orientations (baseline); paired sample two-tailed t-test, p > 0.1. In all cases, recoveries are shown 60 minutes after the adaptation ended.
Figure 3
Figure 3
Synchrony level in relation to the preferred orientation difference in neuron pairs prior to adaptation. (A) Schematic example of raw tuning curves showing the data points (broken lines) for which the synchrony was measured. In this example the preferred orientation difference is 22.5°. CCHs were computed for the initial preferred orientation of each cell and for the adapting orientation. (B) Example of cross-correlation histogram (CCH) where cells had identical preferred orientation (0°). Synchrony index (SI) measured at 0 time lag, SI value was 0.041. Confidence intervals at 99.9% levels are indicated by green lines. (C) Example of CCH where the preferred orientation difference is 45°. In that case, the SI is lower (0.027). (D) Example of CCH where the difference extends to 90° (rare in our sample). The height of the central peak is clearly not significant being below the upper confidence interval, and the SI value was 0.004. Orientation differences from curves fits measurements was 4.0°, 40.0° and 84.1° in B, C and D, respectively. Pairs comprising neurons with distinct preferred orientations (e.g. in C and D) produced 2 CCHs, only one is shown for sake of clarity.
Figure 4
Figure 4
Synchrony and tuning properties difference. (A) Relationship between pairwise synchrony and preferred orientation difference in the control (continuous black line), adaptation (dashed black line) and 60 minutes after adaptation (continuous grey line) conditions (n = 52 neuron pairs). Error bars denote SEM. Curve fits and respective statistics were added. The general shape of the curves is preserved across conditions. However, the adaptation protocol produced a global increase in mean synchrony, which returned toward control level within 60 minutes. (B) Examples of cross-correlation histograms (CCH) for control, adaptation and recovery. In this particular example, an oscillatory activity emerges after adaptation (T ± 20 ms; 50 Hz). However, CCHs displaying oscillatory temporal structures were rarely observed. For this neuron pair, the control preferred orientation difference from raw curves was 22.5°. Adaptation strongly diminished this difference, and was followed by a complete recovery. Curves fits measurements indicate that the preferred orientation difference for this pair changed from 28.8° to 8.6° following the adaptation and returned to 29.2° after 60 min. Confidence intervals at 99.9% and synchronization indexes are indicated for each CCH.
Figure 5
Figure 5
Firing rate and synchrony strength. The firing rate of cell pairs was obtained by adding neuronal responses for each initial preferred orientation, n1 + n2 (n = 82 firing rate values and corresponding SIs). Linear regressions indicate that there is no relationship between firing rate magnitude and synchrony in control conditions (r << 0.01, grey dots) and only a weak positive one in the adaptation condition (r = 0.19, black dots).
Figure 6
Figure 6
Mean SI of cells pairs for the initial optimal (n = 82) and the adapting (n = 52) orientation in the three experimental conditions (error bars are SEM). (A) A significant increase of the mean SI is observed after adaptation for the initial optimal orientation; paired sample two-tailed t-test, p < 0.001. The underneath scatter plots shows that synchrony increases in 65% of cases, 53/82 SI values are above the equality line (broken line). (B) No changes were observed across conditions for the adapting orientation. The underneath scatter plot indicates that SI values are uniformly distributed along the equality line.
Figure 7
Figure 7
Relationship between the preferred orientation difference of cells and synchrony strength. (A) A decrease in preferred orientation difference after adaptation induced a significant rise of the synchrony strength (n = 34 SI values, paired sample two-tailed t-test, p < 0.001). (B) An Increase in preferred orientation difference after adaptation induced no significant rise of the synchrony strength (n = 48 values, paired sample two-tailed t-test, p > 0.1). The black and grey dots represent the control and the adaptation values, respectively. Linear regressions show that there is a negative relationship between the preferred orientation difference and synchrony in each condition (correlation coefficients are indicated for both group). The bolded blue and red dots correspond to the mean values of preferred orientation difference and the synchrony strength (errors bars in both x and y axis are SEM). Note that the preferred orientation difference was calculated using curve fits. In both case, the preferred orientation difference was significantly different between the control and the adaptation condition (paired sample two-tailed t-test, p < 0.0001).
Figure 8
Figure 8
Comparison of synchrony modulation between neuron pairs that recovered and neuron pairs that failed to recover their initial preferred orientation difference. Two levels of synchrony were expected, low (white bars) and high (black bars). The low level of synchronization would be associated to the initial preferred orientation difference. The high level would be associated to the newly acquired, smaller preferred orientation difference. To verify our hypotheses, we tested with a nested ANOVA (1) the difference of the means between the 2 groups (F = 14.90, p < 0.001), and (2) the difference of the means within each group (F = 0.37, p = 0.69). The pairs that displayed recovery (n = 18 SI values) had a significant increase of synchrony followed by a full return to control level within 60 minutes. On the other hand, the pairs that failed to recover their initial preferred orientation difference also showed a significant increase of synchrony after adaptation, but that synchrony level remained high 60 minutes after adaptation.

Similar articles

Cited by

References

    1. Hubel DH, Wiesel TN. Receptive fields of single neurones in the cat's striate cortex. J Physiol. 1959;148:574–591. - PMC - PubMed
    1. Hubel DH, Wiesel TN. Receptive fields and functional architecture of monkey striate cortex. J Physiol. 1968;195:215–243. - PMC - PubMed
    1. Martinez LM, Wang Q, Reid RC, Pillai C, Alonso JM, Sommer FT, Hirsch JA. Receptive field structure varies with layer in the primary visual cortex. Nat Neurosci. 2005;8:372–379. doi: 10.1038/nn1404. - DOI - PMC - PubMed
    1. Bishop PO, Henry GH. Striate neurons: receptive field concepts. Invest Ophthalmol. 1972;11:346–354. - PubMed
    1. Crair MC, Gillespie DC, Stryker MP. The role of visual experience in the development of columns in cat visual cortex. Science. 1998;279:566–570. doi: 10.1126/science.279.5350.566. - DOI - PMC - PubMed

Publication types

LinkOut - more resources