

Mammographic density. Measurement of mammographic density
- PMID: 18598375
- PMCID: PMC2481498
- DOI: 10.1186/bcr2102
Mammographic density. Measurement of mammographic density
Abstract
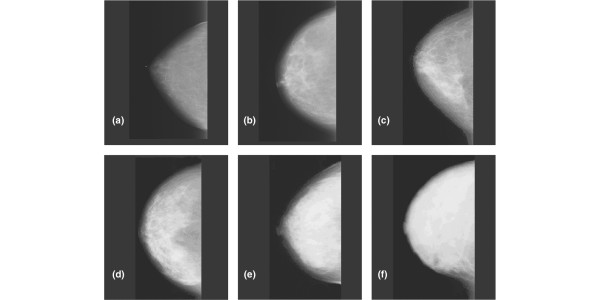
Mammographic density has been strongly associated with increased risk of breast cancer. Furthermore, density is inversely correlated with the accuracy of mammography and, therefore, a measurement of density conveys information about the difficulty of detecting cancer in a mammogram. Initial methods for assessing mammographic density were entirely subjective and qualitative; however, in the past few years methods have been developed to provide more objective and quantitative density measurements. Research is now underway to create and validate techniques for volumetric measurement of density. It is also possible to measure breast density with other imaging modalities, such as ultrasound and MRI, which do not require the use of ionizing radiation and may, therefore, be more suitable for use in young women or where it is desirable to perform measurements more frequently. In this article, the techniques for measurement of density are reviewed and some consideration is given to their strengths and limitations.
Figures
Similar articles
-
Breast cancer risk and measured mammographic density.Eur J Cancer Prev. 1998 Feb;7 Suppl 1:S47-55. doi: 10.1097/00008469-199802001-00010. Eur J Cancer Prev. 1998. PMID: 10866036
-
Background uptake of breast-specific gamma imaging: correlation with mammographic breast density and background enhancement of breast MRI.Clin Imaging. 2014 May-Jun;38(3):255-8. doi: 10.1016/j.clinimag.2013.05.010. Epub 2014 Jan 22. Clin Imaging. 2014. PMID: 24461560
-
Characterization of the homogeneous tissue mixture approximation in breast imaging dosimetry.Med Phys. 2012 Aug;39(8):5050-9. doi: 10.1118/1.4737025. Med Phys. 2012. PMID: 22894430 Free PMC article.
-
Digital mammography: novel applications.Radiol Clin North Am. 2007 Sep;45(5):831-43, vii. doi: 10.1016/j.rcl.2007.06.005. Radiol Clin North Am. 2007. PMID: 17888772 Review.
-
Breast imaging.N Engl J Med. 1984 Apr 12;310(15):960-7. doi: 10.1056/NEJM198404123101506. N Engl J Med. 1984. PMID: 6366562 Review.
Cited by
-
Statistical evaluation of a fully automated mammographic breast density algorithm.Comput Math Methods Med. 2013;2013:651091. doi: 10.1155/2013/651091. Epub 2013 May 8. Comput Math Methods Med. 2013. PMID: 23737861 Free PMC article.
-
Reader variability in breast density estimation from full-field digital mammograms: the effect of image postprocessing on relative and absolute measures.Acad Radiol. 2013 May;20(5):560-8. doi: 10.1016/j.acra.2013.01.003. Epub 2013 Mar 5. Acad Radiol. 2013. PMID: 23465381 Free PMC article.
-
Dense Breast Tissue as an Important Risk Factor for Breast Cancer and Implications for Early Detection.Breast Care (Basel). 2009;4(2):89-92. doi: 10.1159/000211954. Epub 2009 Apr 24. Breast Care (Basel). 2009. PMID: 20847885 Free PMC article.
-
Heterogenous Effect of Risk Factors on Breast Cancer across the Breast Density Categories in a Korean Screening Population.Cancers (Basel). 2020 May 28;12(6):1391. doi: 10.3390/cancers12061391. Cancers (Basel). 2020. PMID: 32481621 Free PMC article.
-
A comparison of calibration data from full field digital mammography units for breast density measurements.Biomed Eng Online. 2013 Nov 9;12:114. doi: 10.1186/1475-925X-12-114. Biomed Eng Online. 2013. PMID: 24207013 Free PMC article.
References
-
- Boyd NF, Lockwood GA, Byng JW, Tritchler DL, Yaffe MJ. Mammographic densities and breast cancer risk. Cancer Epidemiol Biomarkers Prev. 1998;7:1133–1144. - PubMed
-
- Wolfe JN. Breast patterns as an index of risk of developing breast cancer. AJR Am J Roentgenol. 1976;126:1130–1137. - PubMed
-
- Saftlas AF, Szklo M. Mammographic parenchymal patterns and breast cancer risk. Epidemiol Rev. 1987;9:146–174. - PubMed
-
- Goodwin PJ, Boyd NF. Mammographic parenchymal patterns and breast cancer risk: a critical appraisal of the evidence. Am J Epidemiol. 1988;127:1097–1108. - PubMed
Publication types
MeSH terms
LinkOut - more resources
Full Text Sources
Other Literature Sources
Medical
Miscellaneous
