

Topography of the long- to middle-wavelength sensitive cone ratio in the human retina assessed with a wide-field color multifocal electroretinogram
- PMID: 18598401
- PMCID: PMC3044242
- DOI: 10.1017/S0952523808080474
Topography of the long- to middle-wavelength sensitive cone ratio in the human retina assessed with a wide-field color multifocal electroretinogram
Abstract
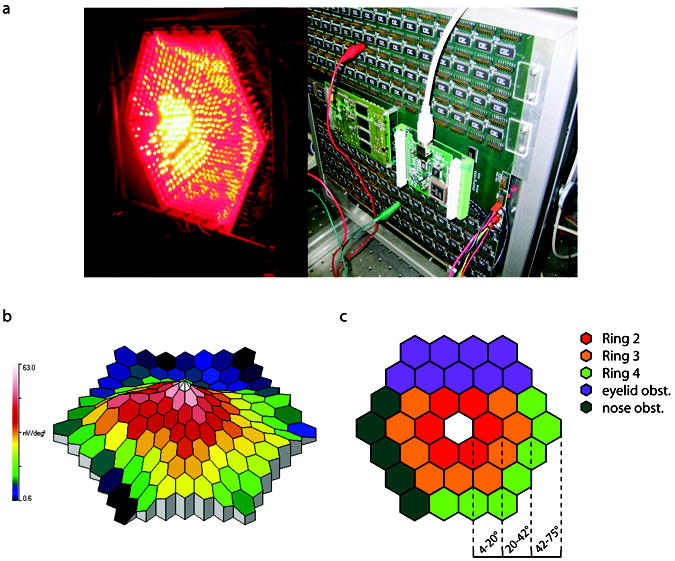
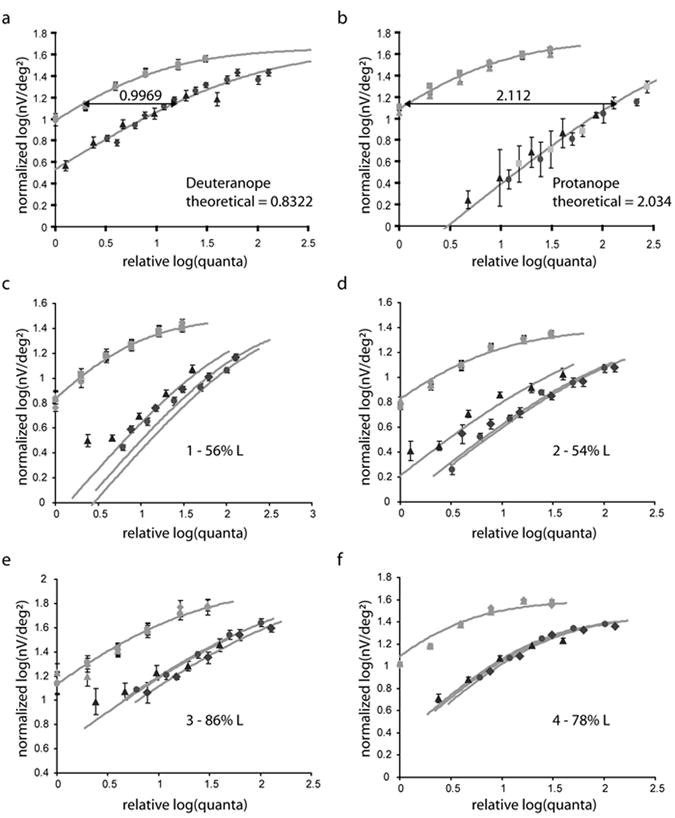
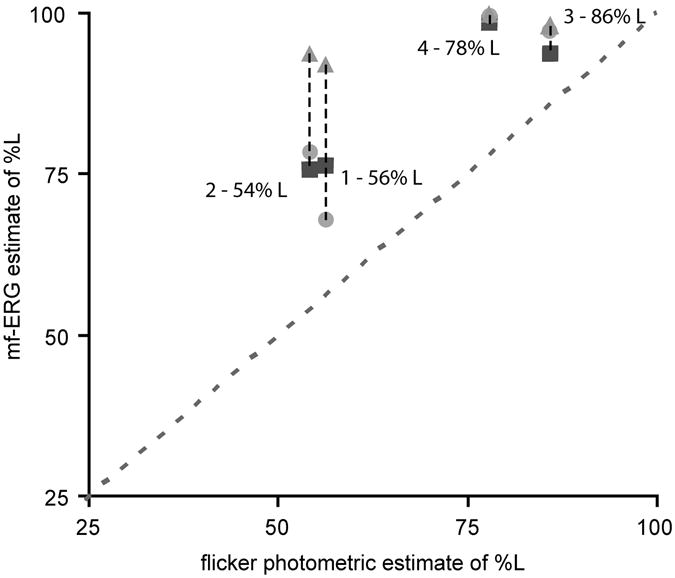
The topographical distribution of relative sensitivity to red and green lights across the retina was assayed using a custom-made wide-field color multifocal electroretinogram apparatus. There were increases in the relative sensitivity to red compared to green light in the periphery that correlate with observed increases in the relative amount of long (L) compared to middle (M) wavelength sensitive opsin mRNA. These results provide electrophysiological evidence that there is a dramatic increase in the ratio of L to M cones in the far periphery of the human retina. The central to far peripheral homogeneity in cone proportions has implications for understanding the developmental mechanisms that determine the identity of a cone as L or M and for understanding the circuitry for color vision in the peripheral retina.
Figures
Similar articles
-
The multifocal pattern electroretinogram (mfPERG) and cone-isolating stimuli.Vis Neurosci. 2007 Nov-Dec;24(6):805-16. doi: 10.1017/S0952523807070733. Vis Neurosci. 2007. PMID: 18093368
-
Ontogeny of ultraviolet-sensitive cones in the retina of rainbow trout (Oncorhynchus mykiss).J Comp Neurol. 2003 Jun 30;461(3):294-306. doi: 10.1002/cne.10682. J Comp Neurol. 2003. PMID: 12746869
-
Spatial and temporal expression of cone opsins during monkey retinal development.J Comp Neurol. 1997 Feb 3;378(1):117-34. J Comp Neurol. 1997. PMID: 9120051
-
Photopigment coexpression in mammals: comparative and developmental aspects.Histol Histopathol. 2005 Apr;20(2):551-74. doi: 10.14670/HH-20.551. Histol Histopathol. 2005. PMID: 15736061 Review.
-
The uncommon retina of the common house mouse.Trends Neurosci. 2001 May;24(5):248-50. doi: 10.1016/s0166-2236(00)01773-2. Trends Neurosci. 2001. PMID: 11311361 Review.
Cited by
-
Evidence of regional specializations in regenerated zebrafish retina.Exp Eye Res. 2021 Nov;212:108789. doi: 10.1016/j.exer.2021.108789. Epub 2021 Oct 13. Exp Eye Res. 2021. PMID: 34653519 Free PMC article. Review.
-
Patterning and Development of Photoreceptors in the Human Retina.Front Cell Dev Biol. 2022 Apr 14;10:878350. doi: 10.3389/fcell.2022.878350. eCollection 2022. Front Cell Dev Biol. 2022. PMID: 35493094 Free PMC article. Review.
-
Longitudinal evaluation of expression of virally delivered transgenes in gerbil cone photoreceptors.Vis Neurosci. 2008 May-Jun;25(3):273-82. doi: 10.1017/S0952523808080577. Vis Neurosci. 2008. PMID: 18598398 Free PMC article.
-
Response Inhibition Is Facilitated by a Change to Red Over Green in the Stop Signal Paradigm.Front Hum Neurosci. 2017 Jan 4;10:655. doi: 10.3389/fnhum.2016.00655. eCollection 2016. Front Hum Neurosci. 2017. PMID: 28101011 Free PMC article.
-
The genetics of normal and defective color vision.Vision Res. 2011 Apr 13;51(7):633-51. doi: 10.1016/j.visres.2010.12.002. Epub 2010 Dec 15. Vision Res. 2011. PMID: 21167193 Free PMC article. Review.
References
-
- Albrecht J, Jägle H, Hood DC, Sharpe LT. The multifocal electroretinogram (mfERG) and cone isolating stimuli: Variation in L-and M-cone driven signals across the retina. Journal of Vision. 2002;2:543–558. - PubMed
-
- Bollinger K, Sjoberg S, Neitz M, Neitz J. Topographical cone photopigment gene expression in deutan-type red-green color vision defects. Vision Research. 2004;34:135–145. - PubMed
-
- Bowmaker JK, Parry JWL, Mollon JD. The arrangement of L and M cones in human and a primate retina. In: Mollon JD, Pokorny J, Knoblauch K, editors. Normal and Defective Colour Vision. New York: Oxford University Press; 2003. pp. 39–50.
-
- Bumsted K, Hendrickson A. Distribution and development of short-wavelength cones differ between Macaca monkey and human fovea. Journal of Comparative Neurology. 1999;403:502–516. - PubMed
-
- Bumsted K, Jasoni C, Szel A, Hendrickson A. Spatial and temporal expression of cone opsins during monkey retinal development. Journal of Comparative Neurology. 1997;378:117–134. - PubMed
Publication types
MeSH terms
Substances
Grants and funding
LinkOut - more resources
Full Text Sources
Other Literature Sources
