. 2008 Sep 15;45(6):826-38.
doi: 10.1016/j.freeradbiomed.2008.06.006. Epub 2008 Jun 12.

Age-related alterations in oxidatively damaged proteins of mouse skeletal muscle mitochondrial electron transport chain complexes

Affiliations

Age-related alterations in oxidatively damaged proteins of mouse skeletal muscle mitochondrial electron transport chain complexes

Kashyap B Choksi et al. Free Radic Biol Med. .

Abstract

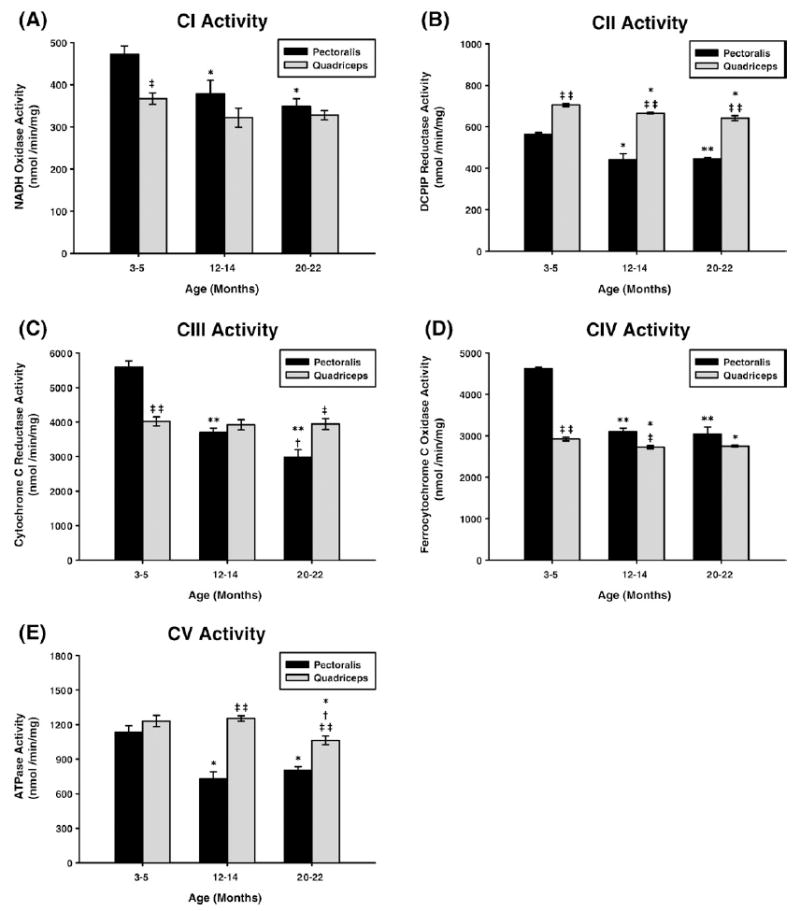
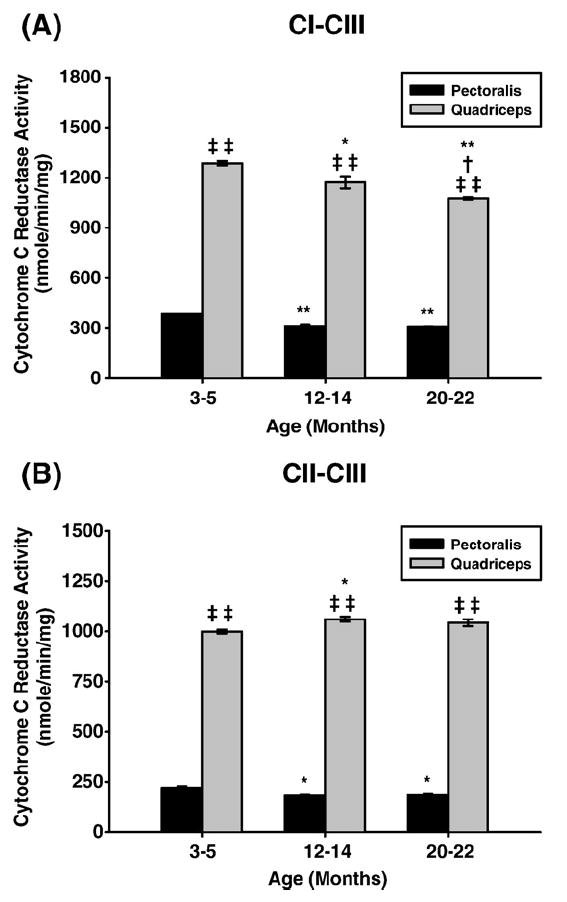
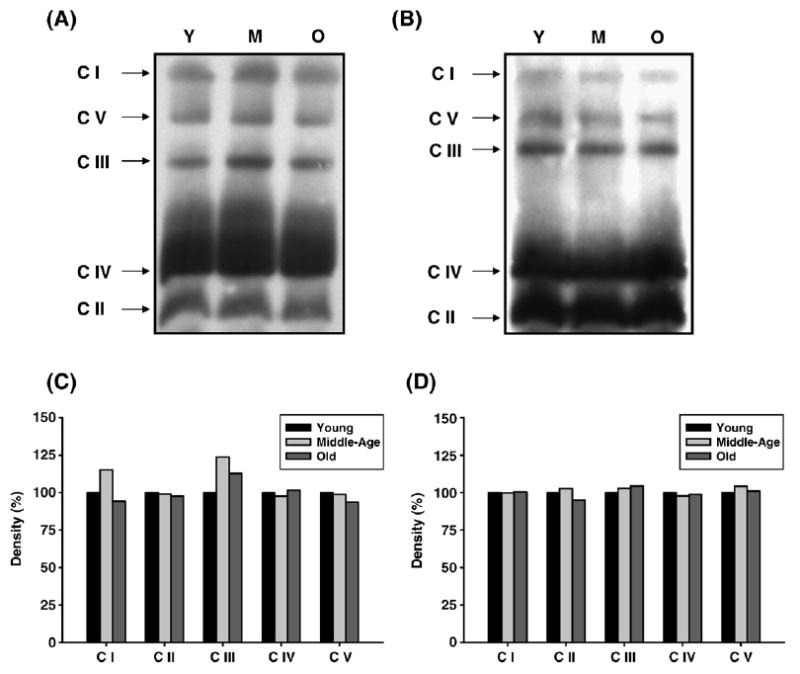
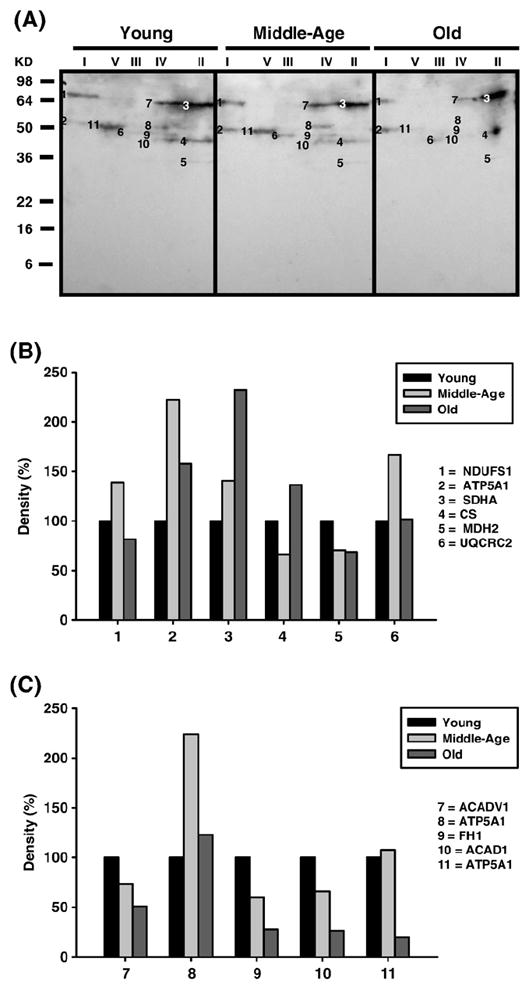
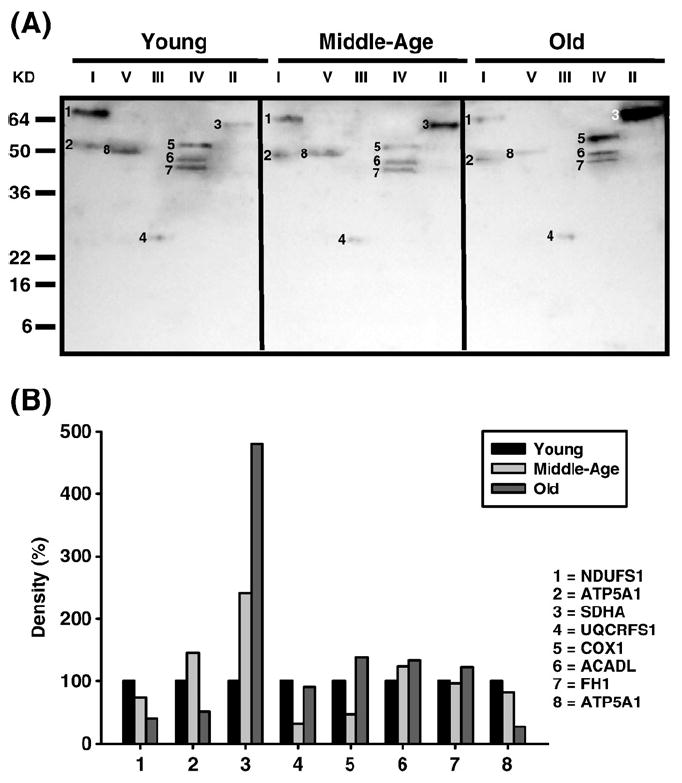
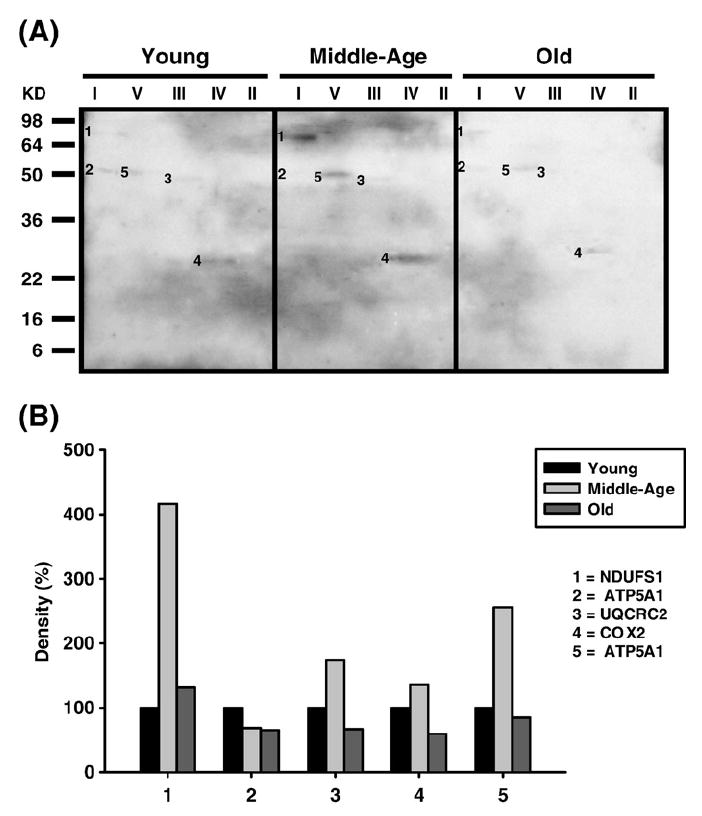
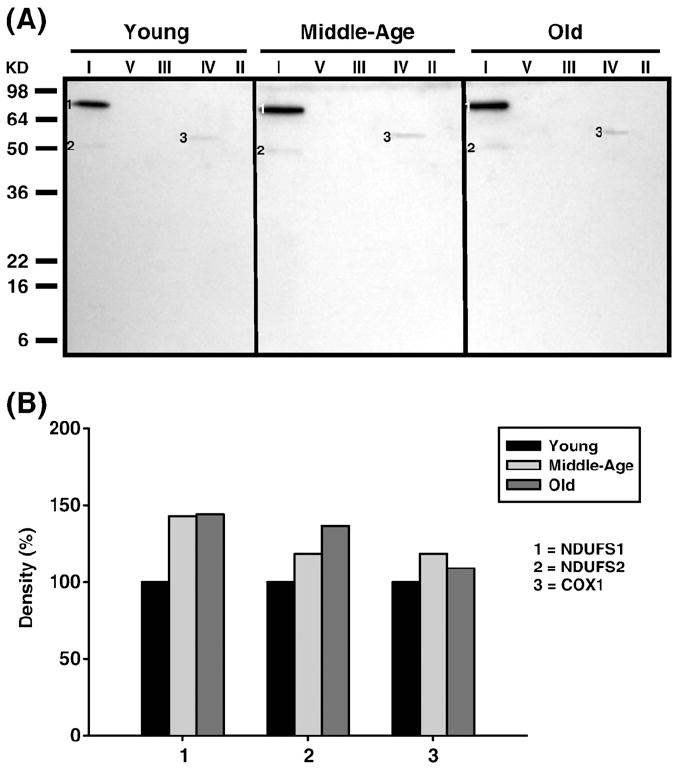
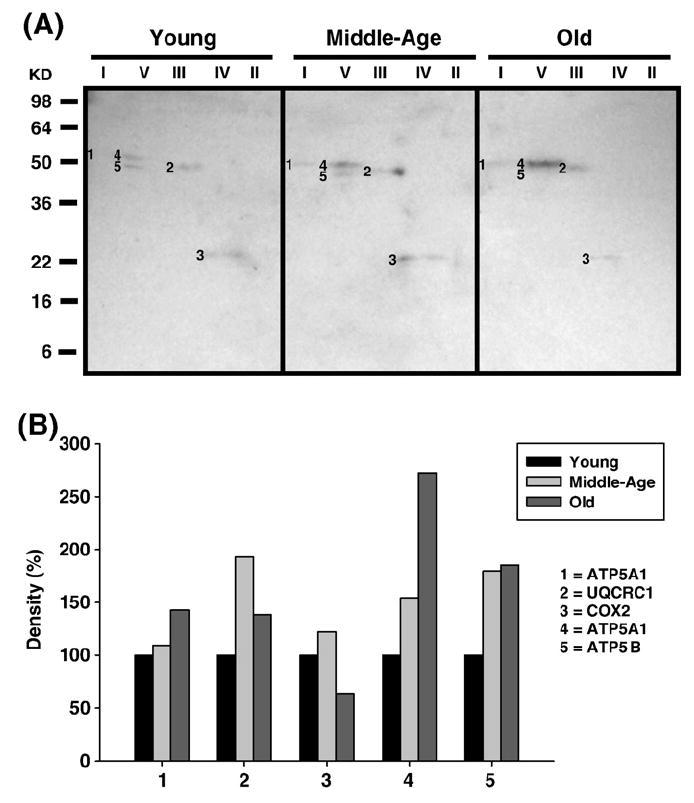
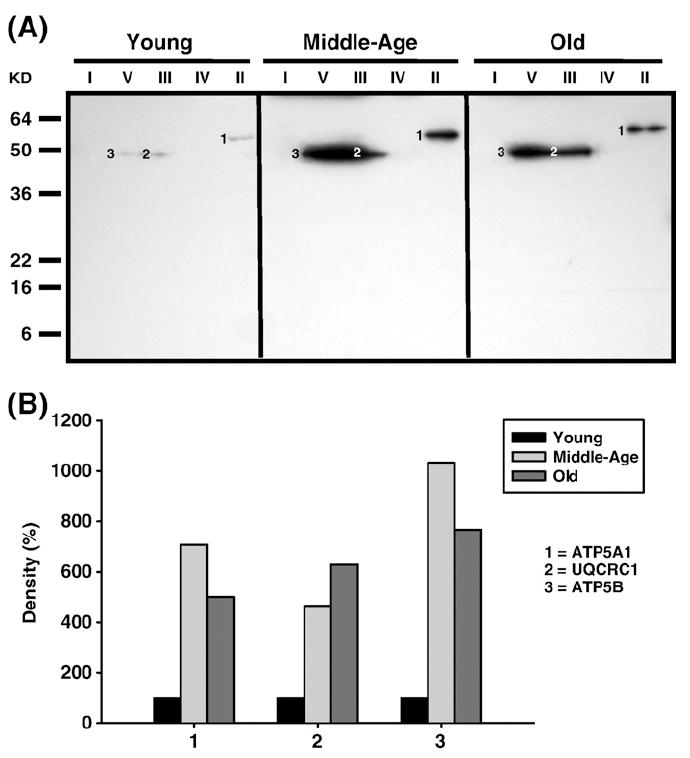
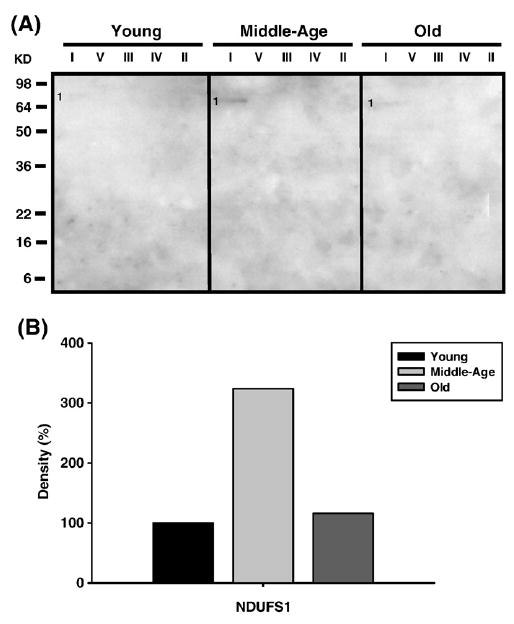
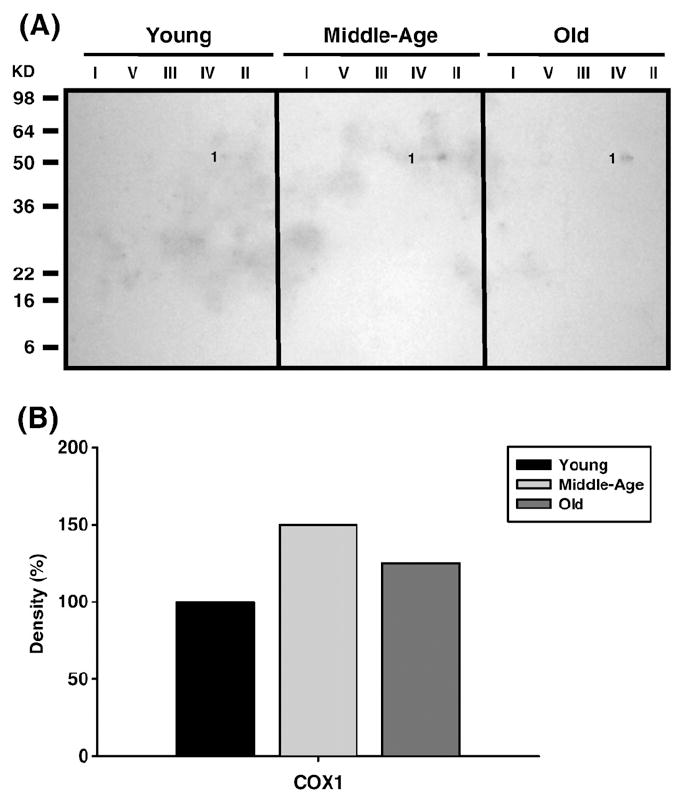
Age-associated mitochondrial dysfunction is a major source of reactive oxygen species (ROS) and oxidative modification to proteins. Mitochondrial electron transport chain (ETC) complexes I and III are the sites of ROS production and we hypothesize that proteins of the ETC complexes are primary targets of ROS-mediated modification which impairs their structure and function. The pectoralis, primarily an aerobic red muscle, and quadriceps, primarily an anaerobic white muscle, have different rates of respiration and oxygen-carrying capacity, and hence, different rates of ROS production. This raises the question of whether these muscles exhibit different levels of oxidative protein modification. Our studies reveal that the pectoralis shows a dramatic age-related decline in almost all complex activities that correlates with increased oxidative modification. Similar complex proteins were modified in the quadriceps, at a significantly lower level with less change in enzyme and ETC coupling function. We postulate that mitochondrial ROS causes damage to specific ETC subunits which increases with age and leads to further mitochondrial dysfunction. We conclude that physiological characteristics of the pectoralis vs quadriceps may play a role in age-associated rate of mitochondrial dysfunction and in the decline in tissue function.


Figures

Fig. 1
Fig. 1
Measurement of ETC complex activities from young (3–5 months), middle-aged (12–14 months), and old (20–22 months) mouse skeletal muscle mitochondria. Individual complex enzyme activities were measured spectrophotometrically as described under Materials and methods. All activity results are averages of 4 assays from the pooled sample±SE for each age group. Citrate synthase assay results were used to normalize mitochondrial proteins. Activities for young (3–5 months), middle-aged (12–14 months), and old (20–22 months) pectoralis and quadriceps ETC CI–CV are plotted as follows: (A) CI activity with aging. Coefficients of variance for pectoralis and quadriceps were 4.2 and 3.8% (young), 6.8 and 6.2% (middle age), and 3.8 and 2.9% (old), respectively. (B) CII activity with aging. Coefficients of variance for pectoralis and quadriceps were 1.3 and 1.1% (young), 5.3 and 0.6% (middle age), and 1 and 2.9% (old), respectively. (C) CIII activity with aging. Coefficients of variance for pectoralis and quadriceps were 3.2 and 3.1% (young), 2.2 and 3.7% (middle age), and 4 and 3.9% (old), respectively. (D) CIV activity with aging. Coefficients of variance for pectoralis and quadriceps were 0.8 and 1.5% (young), 1.9 and 1.2% (middle age), and 3.6 and 0.8% (old), respectively. (E) CV activity with aging. Coefficients of variance for pectoralis and quadriceps were 5.2 and 4% (young), 5.5 and 1.8% (middle age), and 2.9 and 3.1% (old), respectively. * P<0.05 compared to young, ** P<0.001 compared to young, P<0.05 compared to middle aged, ††P<0.001 compared to middle aged, P<0.05 compared to pectoralis, and ‡‡ P<0.001 compared to pectoralis.
Fig. 2
Fig. 2
Measurement of coupled mitochondrial ETC complex activities from young (3–5 months), middle aged (12–14 months), and old (20–22 months) mouse skeletal muscle mitochondria. CI–III and CII–III coupled enzyme activities were measured spectrophotometrically as described under Materials and methods. All activity results are averages of 4 assays from the pooled sample±SE for each age group. Citrate synthase assay results were used to normalize mitochondrial proteins. Activities for young (3–5 months), middle-aged (12–14 months), and old (20–22 months) pectoralis and quadriceps ETC CI–III and CII–III are plotted as follows: (A) CI–CIII coupled activity with aging. Coefficients of variance for pectoralis and quadriceps were 0.5 and 1% (young), 2.7 and 2.8% (middle age), and 1 and 0.5% (old), respectively. (B) CII–CIII coupled activity with aging. Coefficients of variance for pectoralis and quadriceps were 4.7 and 0.9% (young), 1.9 and 1.3% (middle age), and 2.8 and 1.7% (old), respectively. *P<0.05 compared to young, **P<0.001 compared to young, P<0.05 compared to middle aged, P<0.05 compared to pectoralis, and ‡‡P<0.001 compared to pectoralis.
Fig. 3
Fig. 3
Protein abundance of ETC complexes in young (3–5 months), middle-aged (12–14 months), and old (20–22 months) skeletal muscle mitochondria. Skeletal muscle mitochondria (160 μg) from each age group were solubilized and the ETC complexes were separated on a BN-PAGE as described under Materials and Methods. (A) Immunoblot of pectoralis BN-PAGE using complex-specific antibodies. Lane 1, 2, and 3 represent young, middle-aged, and old pectoralis mitochondrial ETC complexes, respectively. (B) Density values of each pectoralis ETC complex band are plotted as a percentage of young complexes. (C) Immunoblot of quadriceps BN-PAGE using complex-specific antibodies. Lane 1, 2, and 3 represent young, middle-aged, and old quadriceps mitochondrial ETC complexes, respectively. (D) Density values of each quadriceps ETC complex band are plotted as a percentage of young complexes. Y, young mitochondria; M, middle-age mitochondria; and O, old mitochondria.
Fig. 4
Fig. 4
Identification of carbonylated proteins of young (3–5 months), middle-aged (12–14 months), and old (20–22 months) pectoralis mitochondrial ETC complex subunits. Pectoralis mitochondrial ETC complexes were resolved into individual subunits and DNP-derivatized after transfer to PVDF membrane as described under Materials and methods followed by immunoblotting. (A) Immunoblot of young, middle-aged, and old pectoralis mitochondrial ETC complex subunits using anti-DNP antibody. Modified proteins were numbered according to their complex localization followed by the highest to the lowest molecular weight of the proteins. Protein loading was normalized using complex-specific antibodies as described under Materials and methods. Normalized density values of each individual carbonylated protein are plotted as a percentage of the young pectoralis protein density for all five ETC complex subunits. (B) Densitometry for modified proteins found in CI (1 and 2), CII (3–5), and CIII (6). (C) Densitometry for modified proteins found in CIV (7–10) and CV (11). Identification of each numbered band is summarized in Table 2.
Fig. 5
Fig. 5
Identification of carbonylated proteins of young (3–5 months), middle-aged (12–14 months), and old (20–22 months) old quadriceps mitochondrial ETC complex subunits. Quadriceps mitochondrial ETC complexes were resolved into individual subunits and DNP-derivatized after transfer to PVDF membrane as described under Materials and methods followed by immunoblotting. (A) Immunoblot of young, middle-aged, and old quadriceps mitochondrial ETC complex subunits using anti-DNP antibody. Modified proteins were numbered according to their complex localization followed by the highest to the lowest molecular weight of the proteins. Protein loading was normalized using complex-specific antibodies as described under Materials and methods. Normalized density values of each individual carbonylated protein are plotted as a percentage of the young quadriceps protein density for all five ETC complex subunits. (B) Densitometry for modified proteins found in CI (1 and 2), CII (3), CIII (4), CIV (5–7), and CV (8). Identification of each numbered band is summarized in Table 3.
Fig. 6
Fig. 6
Identification of HNE-modified proteins of young (3–5 months), middle-aged (12–14 months), and old (20–22 months) pectoralis mitochondrial ETC complex subunits. Pectoralis mitochondrial ETC complexes were resolved into individual subunits as described under Materials and methods followed by immunoblotting. (A) Immunoblot of young, middle-aged, and old pectoralis mitochondrial ETC complex subunits using anti-HNE antibody. Modified proteins were numbered according to their complex localization followed by the highest to the lowest molecular weight of the proteins. Protein loading was normalized using complex-specific antibodies as described under Materials and methods. Normalized density values of each individual protein modified by HNE are plotted as a percentage of the young pectoralis protein density for each specific complex subunit. (B) Densitometry for modified proteins found in CI (1 and 2), CIII (3), CIV (4), and CV (5). Identification of each numbered band is summarized in Table 2.
Fig. 7
Fig. 7
Identification of HNE-modified proteins of young (3–5 months), middle-aged (12–14 months), and old (20–22 months) old quadriceps mitochondrial ETC complex subunits. Quadriceps mitochondrial ETC complexes were resolved into individual subunits as described under Materials and methods followed by immunoblotting. (A) Immunoblot of young, middle-aged, and old quadriceps mitochondrial ETC complex subunits using anti-HNE antibody. Modified proteins were numbered according to their complex localization followed by the highest to the lowest molecular weight of the proteins. Protein loading was normalized using complex-specific antibodies as described under Materials and methods. Normalized density values of each individual protein modified by HNE are plotted as a percentage of the young quadriceps protein density for each specific complex subunit. (B) Densitometry for modified proteins found in CI (1 and 2) and CIV (3). Identification of each numbered band is summarized in Table 3.
Fig. 8
Fig. 8
Identification of nitrotyrosine-modified proteins of young (3–5 months), middle-aged (12–14 months), and old (20–22 months) pectoralis mitochondrial ETC complex subunits. Pectoralis mitochondrial ETC complexes were resolved into individual subunits as described under Materials and methods followed by immunoblotting. (A) Immunoblot of young, middle-aged, and old pectoralis mitochondrial ETC complex subunits using anti-nitrotyrosine antibody. Modified proteins were numbered according to their complex localization followed by the highest to the lowest molecular weight of the proteins. Protein loading was normalized using complex-specific antibodies as described under Materials and methods. Normalized density values of each individual protein modified by nitrotyrosine are plotted as a percentage of the young pectoralis protein density for each specific complex subunit. (B) Densitometry for modified proteins found in CI (1), CIII (2), CIV(3), and CV (4 and 5). Identification of both bands is summarized in Table 2.
Fig. 9
Fig. 9
Identification of nitrotyrosine-modified proteins of young (3–5 months), middle-aged (12–14 months), and old (20–22 months) quadriceps mitochondrial ETC complex subunits. Quadriceps mitochondrial ETC complexes were resolved into individual subunits as described under Materials and methods followed by immunoblotting. (A) Immunoblot of young, middle-aged, and old quadriceps mitochondrial ETC complex subunits using anti-nitrotyrosine antibody. Modified proteins were numbered according to their complex localization followed by the highest to the lowest molecular weight of the proteins. Protein loading was normalized using complex-specific antibodies as described under Materials and methods. Normalized density values of each individual protein modified by nitrotyrosine are plotted as a percentage of the young quadriceps protein density for each specific complex subunit. (B) Densitometry for modified proteins found in CII (1), CIII (2), and CV (3). Identification of both bands is summarized in Table 3.
Fig. 10
Fig. 10
Identification of MDA-modified proteins of young (3–5 months), middle-aged (12–14 months), and old (20–22 months) pectoralis mitochondrial ETC complex subunits. Pectoralis mitochondrial ETC complexes were resolved into individual subunits as described under Materials and methods followed by immunoblotting. (A) Immunoblot of young, middle-aged, and old pectoralis mitochondrial ETC complex subunits using anti-MDA antibody. Protein loading was normalized using complex-specific antibodies as described under Materials and methods. Normalized density values of the individual protein modified by MDA are plotted as a percentage of the young pectoralis protein density for CI subunit. (B) Densitometry for modified protein found in CI. Identification of the CI band is summarized in Table 2.
Fig. 11
Fig. 11
Identification of MDA-modified proteins of young (3–5 months), middle-aged (12–14 months), and old (20–22 months) quadriceps mitochondrial ETC complex subunits. Quadriceps mitochondrial ETC complexes were resolved into individual subunits as described under Materials and methods followed by immunoblotting. (A) Immunoblot of young, middle-aged, and old quadriceps mitochondrial ETC complex subunits using anti-MDA antibody. Protein loading was normalized using complex-specific antibodies as described under Materials and methods. Normalized density values of the individual protein modified by MDA are plotted as a percentage of the young quadriceps protein density for CIV subunit. (B) Densitometry for modified protein found in CIV. Identification of the CIV band is summarized in Table 3.

References

    1. Roubenoff R. Sarcopenia: a major modifiable cause of frailty in the elderly. J Nutr Health Aging. 2000;4:140–142. - PubMed
    1. Marzetti E, Leeuwenburgh C. Skeletal muscle apoptosis, sarcopenia and frailty at old age. Exp Gerontol. 2006;41:1234–1238. - PubMed
    1. Kamel HK. Sarcopenia and aging. Nutr Rev. 2003;61:157–167. - PubMed
    1. Volpi E, Nazemi R, Fujita S. Muscle tissue changes with aging. Curr Opin Clin Nutr Metab Care. 2004;7:405–410. - PMC - PubMed
    1. Harman D. Aging: a theory based on free radical and radiation chemistry. J Gerontol. 1956;11:298–300. - PubMed

Publication types

Substances