

Loss of p21 permits carcinogenesis from chronically damaged liver and kidney epithelial cells despite unchecked apoptosis
- PMID: 18598944
- PMCID: PMC2526059
- DOI: 10.1016/j.ccr.2008.05.004
Loss of p21 permits carcinogenesis from chronically damaged liver and kidney epithelial cells despite unchecked apoptosis
Abstract
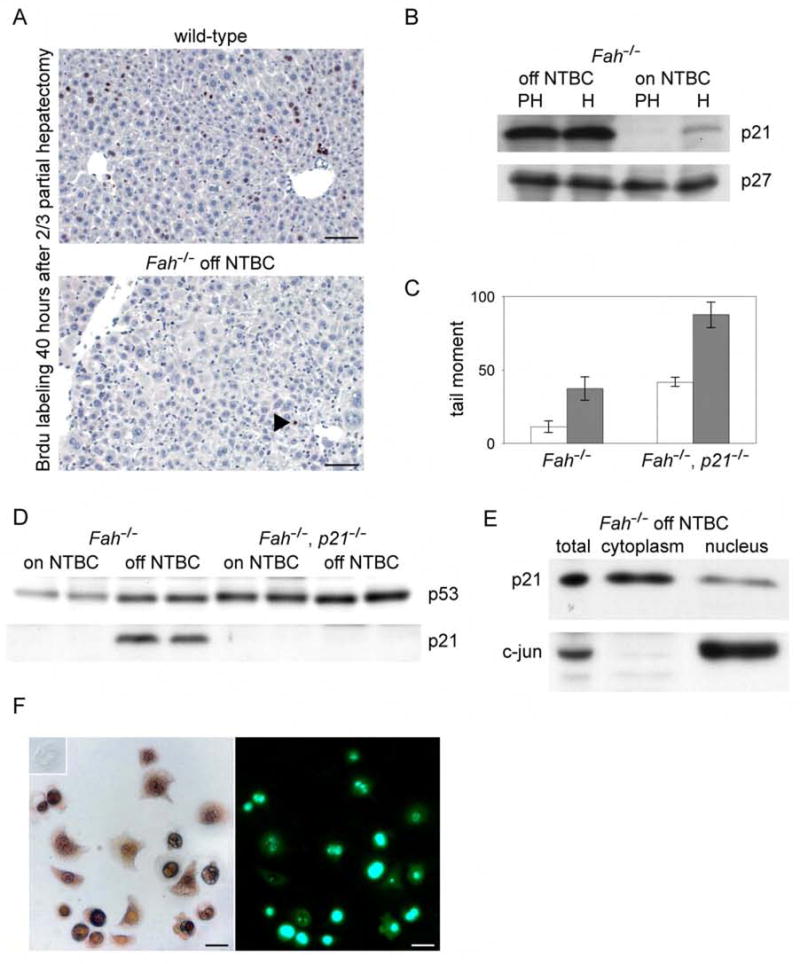
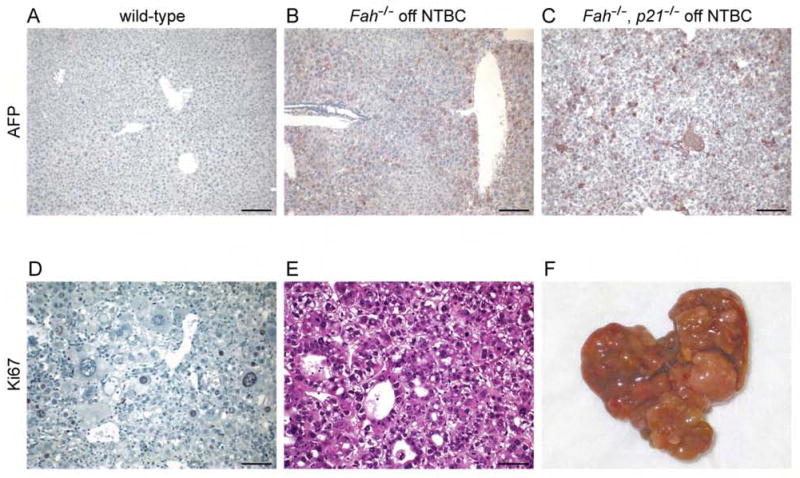
Accumulation of toxic metabolites in hereditary tyrosinemia type I (HT1) patients leads to chronic DNA damage and the highest risk for hepatocellular carcinomas (HCCs) of any human disease. Here we show that hepatocytes of HT1 mice exhibit a profound cell-cycle arrest that, despite concomitant apoptosis resistance, causes mortality from impaired liver regeneration. However, additional loss of p21 in HT1 mice restores the proliferative capabilities of hepatocytes and renal proximal tubular cells. This growth response compensates cell loss due to uninhibited apoptosis and enables animal survival but rapidly leads to HCCs, renal cysts, and renal carcinomas. Thus, p21's antiproliferative function is indispensable for the suppression of carcinogenesis from chronically injured liver and renal epithelial cells and cannot be compensated by apoptosis.
Figures


Comment in
-
A dual role of p21 in liver regeneration and hepatocarcinogenesis.Hepatology. 2008 Nov;48(5):1713-4. doi: 10.1002/hep.22588. Hepatology. 2008. PMID: 18972555 No abstract available.
Similar articles
-
Renal proximal tubular cells acquire resistance to cell death stimuli in mice with hereditary tyrosinemia type 1.Kidney Int. 2004 Sep;66(3):990-1000. doi: 10.1111/j.1523-1755.2004.00788.x. Kidney Int. 2004. PMID: 15327392
-
Kidneys of mice with hereditary tyrosinemia type I are extremely sensitive to cytotoxicity.Pediatr Res. 2006 Mar;59(3):365-70. doi: 10.1203/01.pdr.0000198810.57642.b4. Pediatr Res. 2006. PMID: 16492973
-
Hepatic stress in hereditary tyrosinemia type 1 (HT1) activates the AKT survival pathway in the fah-/- knockout mice model.J Hepatol. 2008 Feb;48(2):308-17. doi: 10.1016/j.jhep.2007.09.014. Epub 2007 Dec 3. J Hepatol. 2008. PMID: 18093685
-
Liver Cancer in Tyrosinemia Type 1.Adv Exp Med Biol. 2017;959:101-109. doi: 10.1007/978-3-319-55780-9_9. Adv Exp Med Biol. 2017. PMID: 28755188 Review.
-
Molecular Pathogenesis of Liver Injury in Hereditary Tyrosinemia 1.Adv Exp Med Biol. 2017;959:49-64. doi: 10.1007/978-3-319-55780-9_4. Adv Exp Med Biol. 2017. PMID: 28755183 Review.
Cited by
-
A genetic screen reveals Foxa3 and TNFR1 as key regulators of liver repopulation.Genes Dev. 2015 May 1;29(9):904-9. doi: 10.1101/gad.258855.115. Genes Dev. 2015. PMID: 25934503 Free PMC article.
-
Lack of p21 expression links cell cycle control and appendage regeneration in mice.Proc Natl Acad Sci U S A. 2010 Mar 30;107(13):5845-50. doi: 10.1073/pnas.1000830107. Epub 2010 Mar 15. Proc Natl Acad Sci U S A. 2010. PMID: 20231440 Free PMC article.
-
Mouse liver repopulation with hepatocytes generated from human fibroblasts.Nature. 2014 Apr 3;508(7494):93-7. doi: 10.1038/nature13020. Epub 2014 Feb 23. Nature. 2014. PMID: 24572354 Free PMC article.
-
Efficient liver repopulation of transplanted hepatocyte prevents cirrhosis in a rat model of hereditary tyrosinemia type I.Sci Rep. 2016 Aug 11;6:31460. doi: 10.1038/srep31460. Sci Rep. 2016. PMID: 27510266 Free PMC article.
-
Identification of key proteins in the signaling crossroads between wound healing and cancer hallmark phenotypes.Sci Rep. 2021 Aug 26;11(1):17245. doi: 10.1038/s41598-021-96750-5. Sci Rep. 2021. PMID: 34446793 Free PMC article.
References
-
- Al-Dhalimy M, Overturf K, Finegold M, Grompe M. Long-term therapy with NTBC and tyrosine-restricted diet in a murine model of hereditary tyrosinemia type I. Mol Genet Metab. 2002;75:38–45. - PubMed
-
- Albrecht JH, Poon RY, Ahonen CL, Rieland BM, Deng C, Crary GS. Involvement of p21 and p27 in the regulation of CDK activity and cell cycle progression in the regenerating liver. Oncogene. 1998;16:2141–2150. - PubMed
-
- Bartosiewicz MJ, Jenkins D, Penn S, Emery J, Buckpitt A. Unique gene expression patterns in liver and kidney associated with exposure to chemical toxicants. J Pharmacol Exp Ther. 2001;297:895–905. - PubMed
-
- Bhunia AK, Piontek K, Boletta A, Liu L, Qian F, Xu PN, Germino FJ, Germino GG. PKD1 induces p21(waf1) and regulation of the cell cycle via direct activation of the JAK-STAT signaling pathway in a process requiring PKD2. Cell. 2002;109:157–168. - PubMed
-
- Brugarolas J, Chandrasekaran C, Gordon JI, Beach D, Jacks T, Hannon GJ. Radiation-induced cell cycle arrest compromised by p21 deficiency. Nature. 1995;377:552–557. - PubMed
Publication types
MeSH terms
Substances
Grants and funding
LinkOut - more resources
Full Text Sources
Other Literature Sources
Molecular Biology Databases
