Comparative Study
. 2008 Aug;38(4):607-15.
doi: 10.1016/j.mcn.2008.05.009. Epub 2008 May 20.

Functional properties and differential neuromodulation of Na(v)1.6 channels

Affiliations
Comparative Study

Functional properties and differential neuromodulation of Na(v)1.6 channels

Yuan Chen et al. Mol Cell Neurosci. 2008 Aug.

Abstract

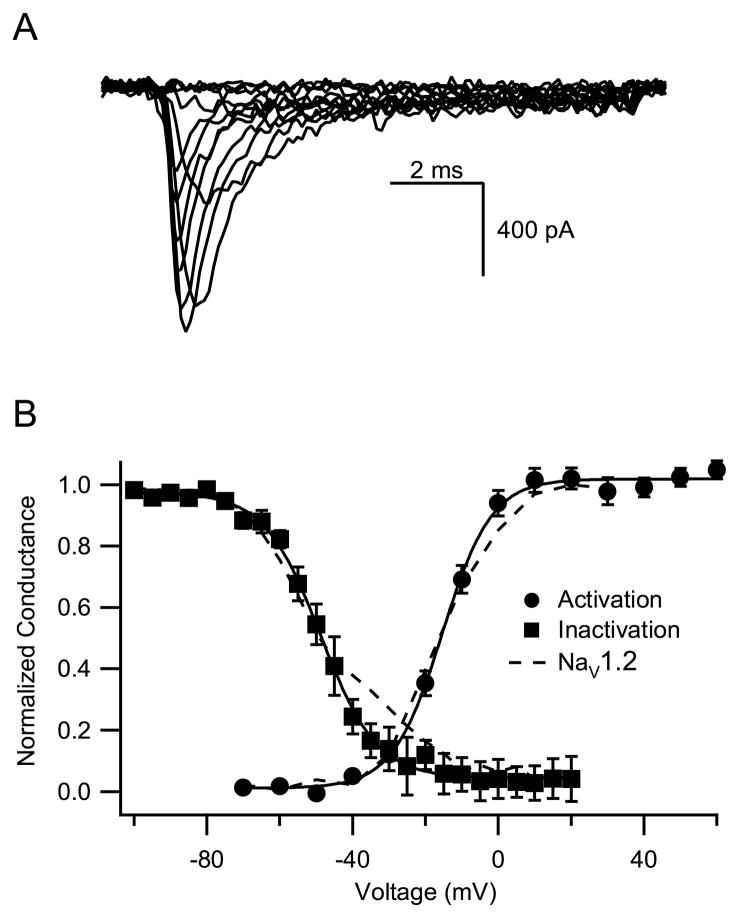
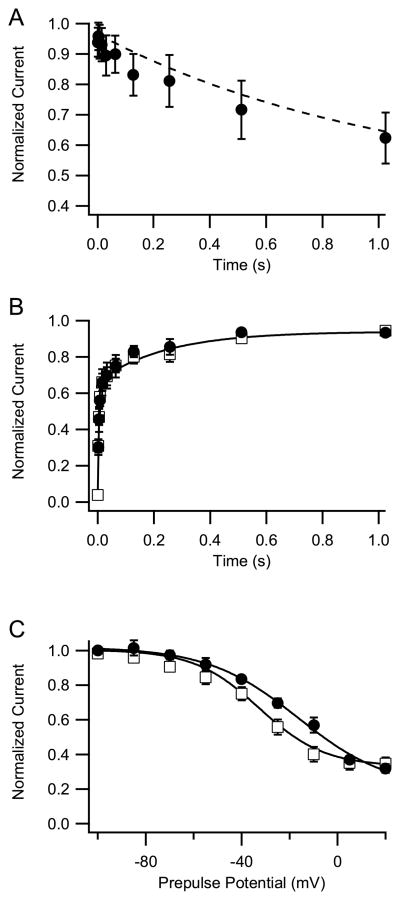
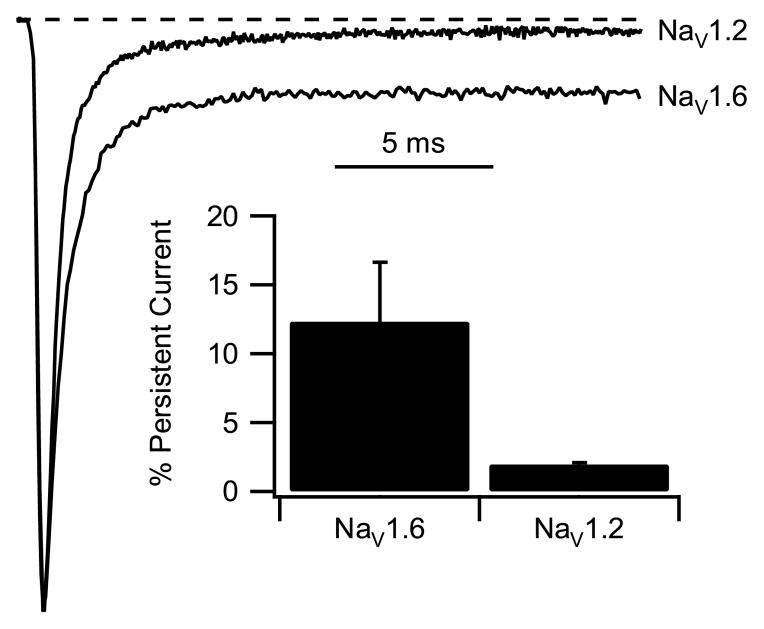
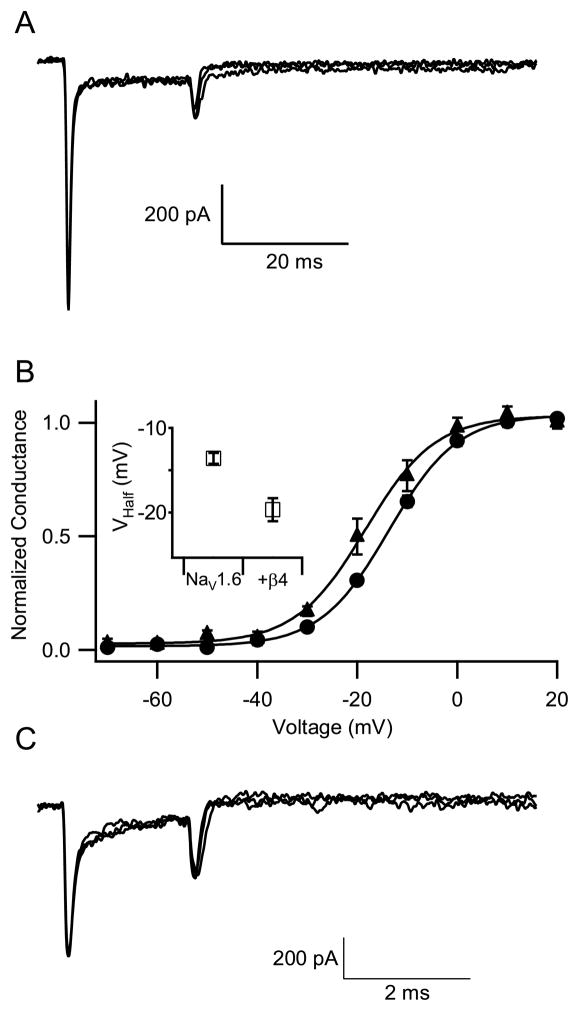
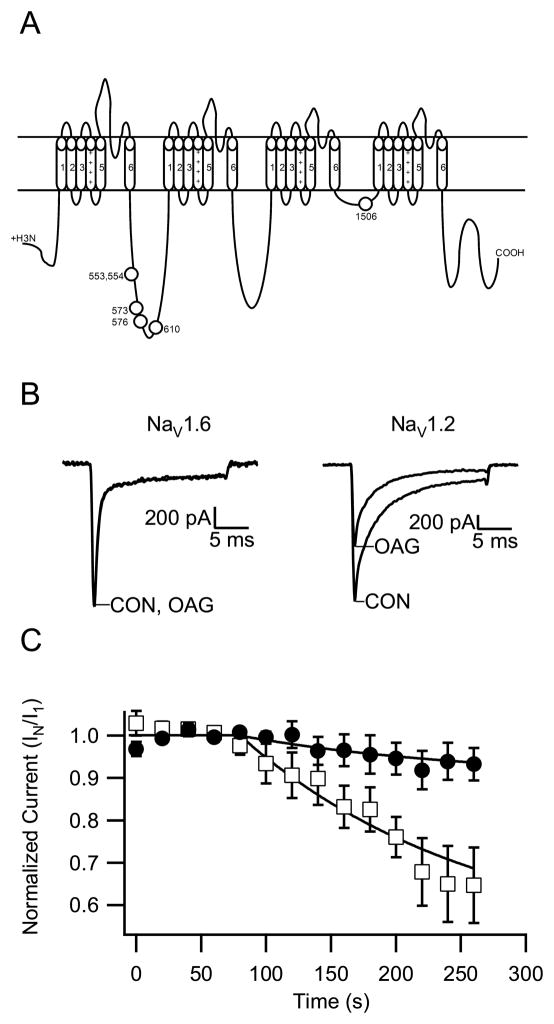
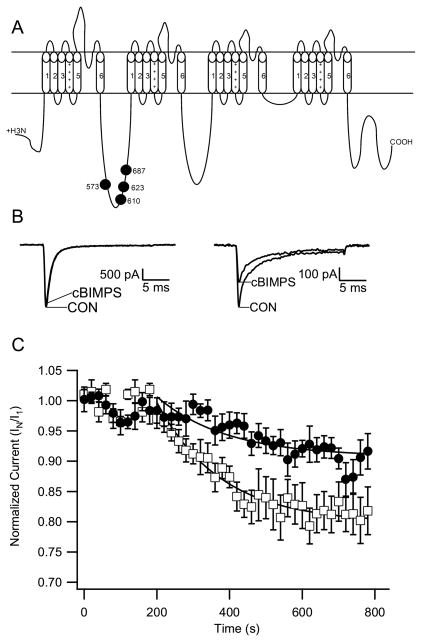
The voltage-gated sodium channel Na(v)1.6 plays unique roles in the nervous system, but its functional properties and neuromodulation are not as well established as for Na(V)1.2 channels. We found no significant differences in voltage-dependent activation or fast inactivation between Na(V)1.6 and Na(V)1.2 channels expressed in non-excitable cells. In contrast, the voltage dependence of slow inactivation was more positive for Na(v)1.6 channels, they conducted substantially larger persistent sodium currents than Na(v)1.2 channels, and they were much less sensitive to inhibition by phosphorylation by cAMP-dependent protein kinase and protein kinase C. Resurgent sodium current, a hallmark of Na(v)1.6 channels in neurons, was not observed for Na(V)1.6 expressed alone or with the auxiliary beta(4) subunit. The unique properties of Na(V)1.6 channels, together with the resurgent currents that they conduct in neurons, make these channels well-suited to provide the driving force for sustained repetitive firing, a crucial property of neurons.


Figures

Fig. 1
Fig. 1
Voltage dependence of activation and fast inactivation of NaV1.6 channels. (A) Example sodium current records. (B) Activation. From a holding potential of −100 mV, a test pulse to the indicated potentials was applied for 10 ms and the sodium current was measured. Conductance was calculated from the peak sodium current and the reversal potential. Nav1.6, V1/2 = −13.6±0.6 mV, k = 6.7± 0.3, n=9; Nav1.2a, V1/2 = −14.9±3.7 mV, k = 6.8 ± 0.6. Fast inactivation. From a holding potential of −100 mV, a prepulse to the indicated potentials was applied for 100 ms, followed by a test pulse to 10 mV for 10 ms. Peak sodium currents during the test pulses were recorded and plotted versus the potential of the prepulse. Nav1.6, V1/2 = −47.4 ± 2.4, k = 8.4 ± 1.2, n=4; Nav1.2a = −48.8 ± 0.8 mV, k = 9.5 ± 0.7
Fig. 2
Fig. 2
Slow inactivation of NaV1.6 channels. (A) Onset of slow inactivation. From a holding potential of −100 mV, a test pulse to 10 mV for 10 ms was applied and the sodium current was measured. A prepulse to 10 mV for the indicated times was then applied, the cells were repolarized to −100 mV for 20 ms to allow recovery from fast inactivation, and a second test pulse to 10 mV for 10 ms was applied. The mean (±SEM) ratio of peak sodium currents measured during the second test pulse to those measured during the first test pulse is plotted against prepulse duration (n=5). The dashed line is the fit to the NaV1.2 data from Chen et al. (2006) recorded under identical conditions. The data at different prepulse durations were fit with a single exponential. Circles, NaV1.6; dashed line, NaV1.2. (B) Recovery from slow inactivation. From a holding potential of −100 mV, a test pulse to 10 mV for 10 ms was applied and the sodium current was measured. A prepulse to 10 mV for 1s was then applied, the cells were repolarized to −100 mV for the indicated times to allow recovery from inactivation, a second test pulse to 10 mV for 2 ms was applied, and sodium currents were measured for WT and the indicated mutants. The mean (±SEM) ratio of peak amplitude of sodium current evoked in the second test pulse to that evoked in the first test pulse is plotted against the duration of the interpulse and fit to a single exponential (n=6). NaV1.6, circles; NaV1.2a, squares. (C) Voltage dependence of slow inactivation. From a holding potential of −100 mV, a test pulse to 10 mV for 10 ms was applied and the sodium current was measured. A conditioning prepulse to the indicated potentials was then applied for 5s, the cells were repolarized to −100 mV for 20 ms to allow recovery of fast inactivation, a second test pulse to 10 mV for 10 ms was applied, and sodium currents were measured. The mean (±SEM) ratios of the peak sodium current recorded during the test pulse to the sodium current recorded before the conditioning prepulse were plotted against the voltage of the conditioning pulse, and the data were fit to the Boltzmann equation. Nav1.6, V1/2 =−16.4 ± 3.5, k = 18.9 ± 2.9, n= 6; Nav1.2a, V1/2 =−33.1, k = 13.0 ± 1.5. NaV1.6, circles; NaV1.2a, squares. All NaV1.2a data are from Chen et. al. (2006).
Fig. 3
Fig. 3
Persistent sodium current of Nav1.6 channels. Average current traces depolarization to +30 mV from a holding potential of −100 mV. Lower trace, NaV1.6; upper trace, Nav1.2a. Inset. Bar graph representing the percentage of persistent current. Persistent currents were averaged between 16 to 18 ms after the beginning of the depolarization and divided by their peak amplitude. NaV1.6, 12.3 ± 4.3%, n=6; NaV1.2a, 2.0 ± 0.8%.
Fig. 4
Fig. 4
Resurgent sodium current of NaV1.6 channels. (A) From a holding potential of −100 mV, a cell expressing NaV1.6 channels was depolarized by a prepulse to +30 mV for 40 ms to activate and inactivate sodium channels. Each prepulse was followed immediately by a single 20-ms test pulse to potentials from −60 mV to +20 mV in 10 mV increments. Representative current traces for test pulses to −60, −50, and −40 mV are shown. (B) Effect of β4 subunits on the voltage dependence of activation. The voltage dependence of activation was measured as in Fig. 1. NaV1.6, circles; NaV1.6 + β4, triangles. Inset. The graph shows the voltage of half-maximal activation for NaV1.6 alone (−13.6±0.6 mV, n=9) and Nav1.6 co-expressed with β4 subunits (−19.7±1.4 mV, n=6, p<0.05). (C) An experiment similar to panel A with NaV1.6 channels co-expressed with β4 subunits.
Fig. 5
Fig. 5
Modulation of Nav1.6 channels by PKC. (A) PKC phosphorylation sites of NaV1.2 channels. (B) From a holding potential of −70 mV, sodium currents were evoked every 20 s by a 20-ms test pulse to 10 mV. Perfusion with OAG (50 μM) began at 60 s. Representative current traces for Nav1.6 before and after OAG (left) and Nav1.2a before and after OAG (right) are shown. (C) Time course of mean (± SEM) normalized peak sodium currents following addition of OAG. At 200 s, the mean peak sodium currents were reduced as follows: NaV1.6, 6.8 ± 3.9% (n=6); NaV1.2a, 35.3 ± 8.9% (n=7).
Fig. 6
Fig. 6
Modulation of Nav1.6 channels by PKA. (A) PKA phosphorylation sites on NaV1.2 channels. (B) From a holding potential of −70 mV, sodium currents were evoked every 20 s by a 20-ms test pulse to 10 mV. Perfusion with cBIMPS (50 μM) began at 60 s. Representative current traces for Nav1.6 before and after cBIMPS (left) and Nav1.2a before and after cBIMPS (right) are shown. (C) Time course of mean (±SEM) normalized peak sodium currents following addition of cBIMPS. The peak sodium currents were reduced by the following amounts at 200 ms: NaV1.6, 8.4 ± 2.9% (circles, n = 6); NaV1.2a, 21.7 ± 3.1% (squares, n = 5).

References

    1. Auld VJ, Goldin AL, Krafte DS, Catterall WA, Lester HA, Davidson N, Dunn RJ. A neutral amino acid change in segment IIS4 dramatically alters the gating properties of the voltage-dependent sodium channel. Proc Natl Acad Sci U S A. 1990;87:323–327. - PMC - PubMed
    1. Balser JR. Inherited sodium channelopathies: novel therapeutic and proarrhythmic molecular mechanisms. Trends Cardiovasc Med. 2002;11:229–237. - PubMed
    1. Boiko T, Rasband MN, Levinson SR, Caldwell JH, Mandel G, Trimmer JS, Matthews G. Compact myelin dictates the differential targeting of two sodium channel isoforms in the same axon. Neuron. 2001;30:91–104. - PubMed
    1. Burbidge SA, Dale TJ, Powell AJ, Whitaker WR, Xie XM, Romanos MA, Clare JJ. Molecular cloning, distribution and functional analysis of the NA(V)1.6. Voltage-gated sodium channel from human brain. Mol Brain Res. 2002;103:80–90. - PubMed
    1. Burgess DL, Kohrman DC, Galt J, Plummer NW, Jones JM, Spear B, Meisler MH. Mutation of a new sodium channel gene, Scn8a, in the mouse mutant ‘motor endplate disease’. Nat Genet. 1995;10:461–465. - PubMed

Publication types