. 2008 Aug;8(2):157-68.
doi: 10.1016/j.cmet.2008.06.011. Epub 2008 Jul 3.

Resveratrol delays age-related deterioration and mimics transcriptional aspects of dietary restriction without extending life span

Affiliations

Resveratrol delays age-related deterioration and mimics transcriptional aspects of dietary restriction without extending life span

Kevin J Pearson et al. Cell Metab. 2008 Aug.

Abstract

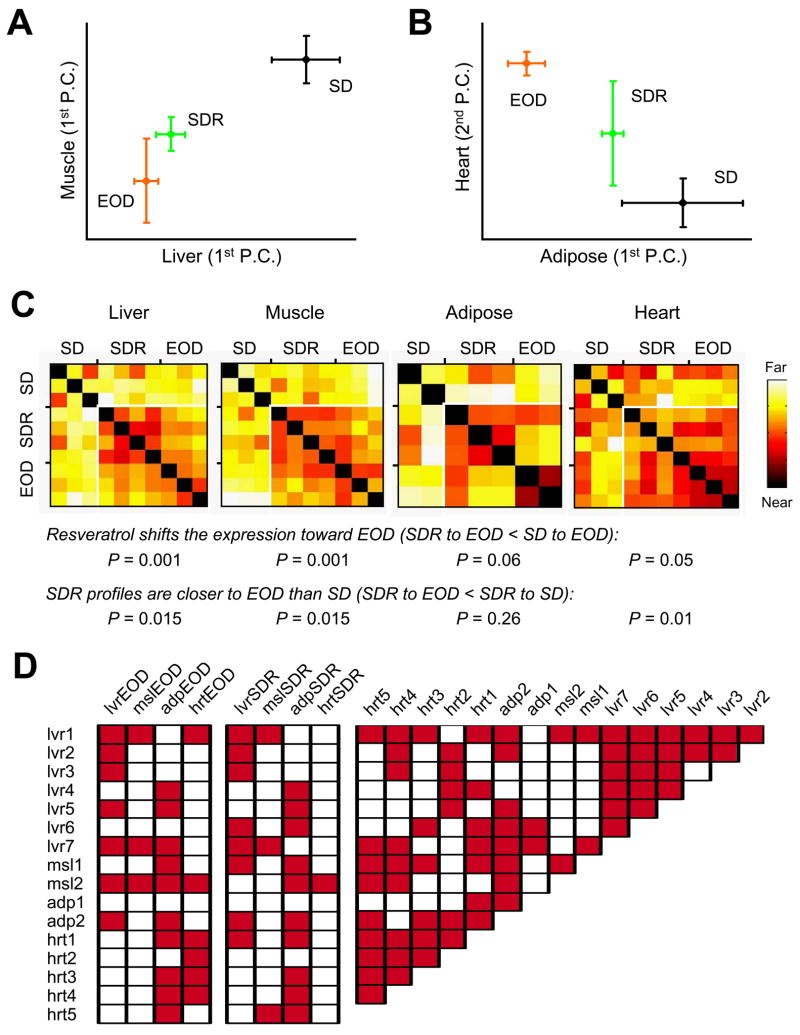
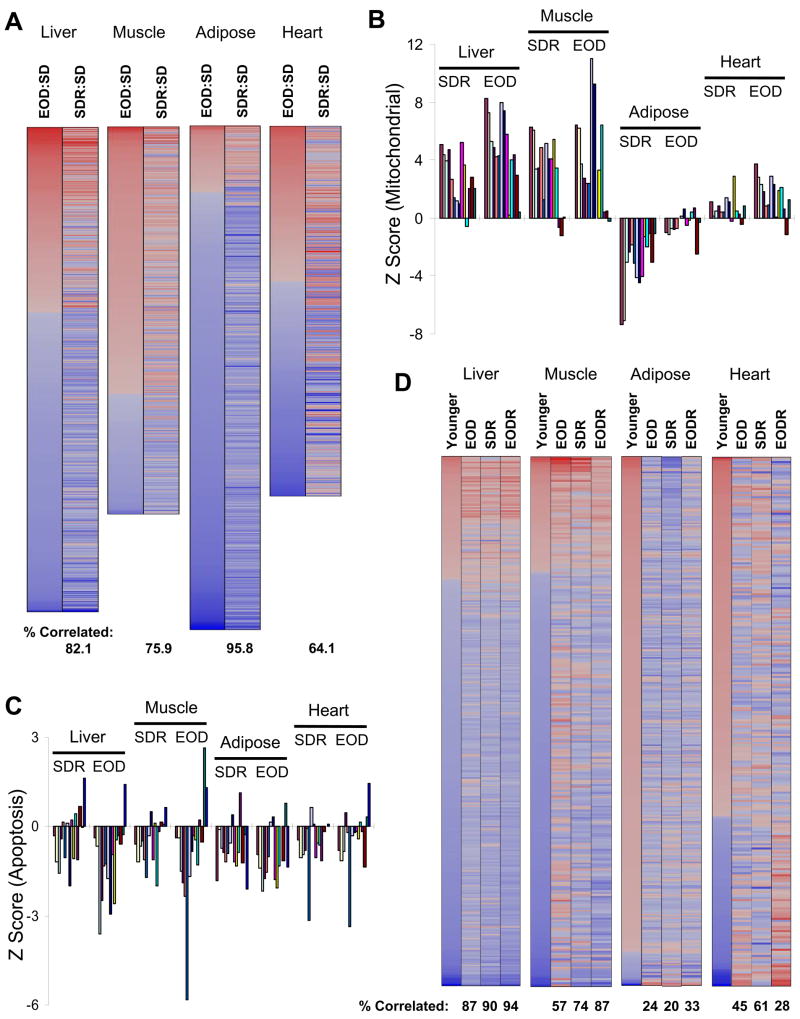
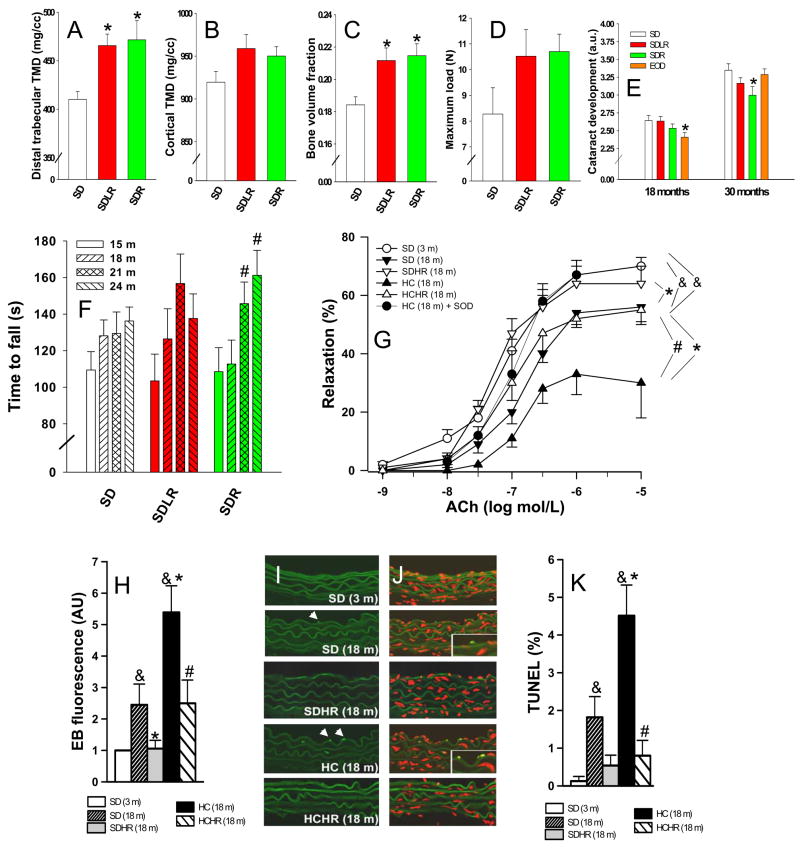
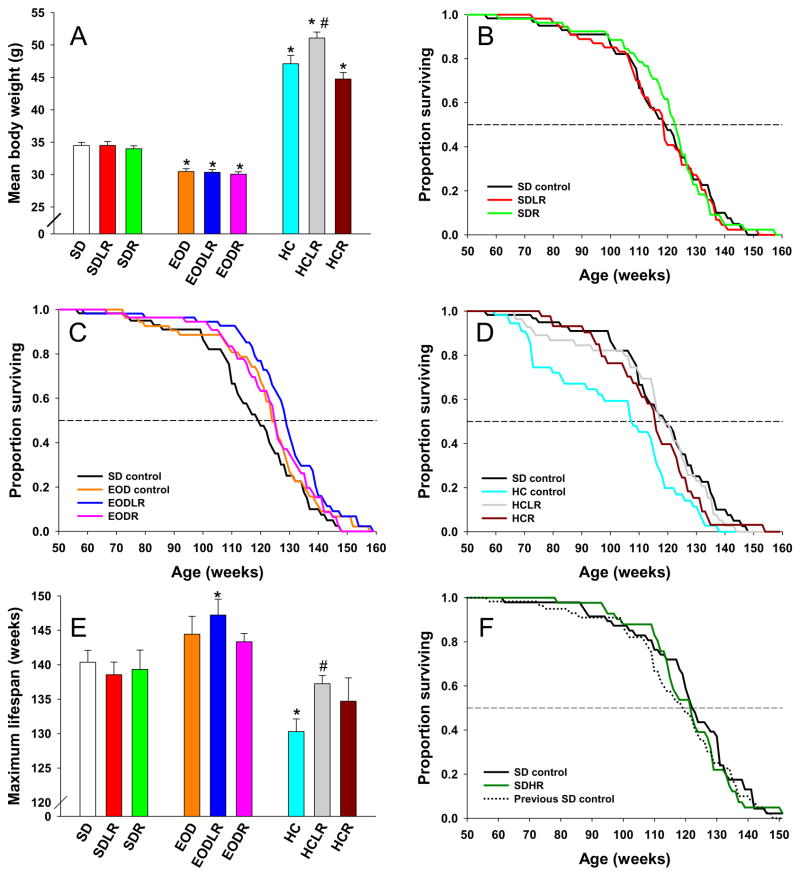
A small molecule that safely mimics the ability of dietary restriction (DR) to delay age-related diseases in laboratory animals is greatly sought after. We and others have shown that resveratrol mimics effects of DR in lower organisms. In mice, we find that resveratrol induces gene expression patterns in multiple tissues that parallel those induced by DR and every-other-day feeding. Moreover, resveratrol-fed elderly mice show a marked reduction in signs of aging, including reduced albuminuria, decreased inflammation, and apoptosis in the vascular endothelium, increased aortic elasticity, greater motor coordination, reduced cataract formation, and preserved bone mineral density. However, mice fed a standard diet did not live longer when treated with resveratrol beginning at 12 months of age. Our findings indicate that resveratrol treatment has a range of beneficial effects in mice but does not increase the longevity of ad libitum-fed animals when started midlife.


Figures

Figure 1
Figure 1. Resveratrol and dietary restriction have overlapping effects on gene expression
(A, B) Principal component analysis (PCA) was performed on differentially expressed genes from SD, SDR, and EOD for liver, muscle, adipose, and heart. First PCs (the sets of correlated changes that capture the most variability between samples) for liver, muscle, and adipose are presented in panels 1A and 1B. Each shows a shift of the gene expression pattern in resveratrol-treated animals (SDR) toward that induced by every-other-day feeding (EOD). In heart, the first PC did not show this effect, however the second PC (shown) was nearly equal and did reveal a similar shift. Error bars are 95% confidence intervals. (C) Distances were calculated in high-dimensional space for each pair of samples. Each square shows the distance between two individual samples, ranging from zero (deep red, see comparisons to self on the diagonal) to highly divergent (white). In each tissue, distances between SDR and EOD samples (lower right portion) tend to be smaller than those to SD samples. P values were determined by Kruskal-Wallis (nonparametric) one-way ANOVA, and are similar, but slightly more conservative than those obtained by standard ANOVA. (D) To compare our transcriptional profiles of EOD and resveratrol treatment to published data on 10–44% caloric restriction (Corton et al., 2004; Dhahbi et al., 2005; Dhahbi et al., 2006; Edwards et al., 2007; Fu et al., 2006; Higami et al., 2004; Lee et al., 2002; Selman et al., 2006; Tsuchiya et al., 2004), we generated differential expression signatures (Swindell, 2008). For each pair of transcriptional profiles, the significance of the overlap in expression changes was evaluated by permutation testing and adjusted for multiple comparisons using the Benjamini-Hochberg method (Benjamini and Hochberg, 1995). Publicly available datasets are assigned a name based on the tissue examined and described in detail in Table S2. Shaded boxes indicate significant associations (P < 0.05).
Figure 2
Figure 2. Resveratrol shifts expression patterns in mice on a standard diet towards those of mice on a calorie restricted diet
(A) Parametric analysis of gene-set enrichment (PAGE) was performed on microarray data from mice fed a standard diet plus resveratrol (SDR) or subjected to EOD feeding. Columns show every pathway significantly up-regulated (red) or down-regulated (blue) by either treatment at 27 months of age. The directions of changes induced by resveratrol and EOD feeding were highly correlated in liver (82% of 503 pathways), muscle (76% of 398 pathways), and adipose (96% of 524 pathways), and weakly correlated (64% of 375 pathways) in heart. (B) The effect of resveratrol and EOD on mitochondria-related pathways from the PAGE analysis for liver, skeletal muscle, adipose and heart at 27 months of age. (C) The effect of resveratrol and EOD feeding on apoptosis-related pathways from the PAGE analysis for liver, skeletal muscle, adipose, and heart at 27 months of age. Full names and Z scores for each of the pathways represented in panels B and C are presented in the supplemental material. (D) PAGE analysis was reexamined to identify changes in transcriptional patterns between control (SD) mice at 18 and 27 months of age for liver, muscle, adipose and heart. For each of the pathways found to be significantly different in the 18-month-old (“younger”) mice compared to 27-month-old mice (359, 270, 365, and 256 pathways in liver, muscle, adipose, and heart, respectively), the corresponding Z scores are also presented for EOD, SDR, and EODR mice at 27 months of age (compared to the same 27-month-old controls).
Figure 3
Figure 3. Resveratrol improves the health of mice fed a standard diet
Femurs were removed following natural deaths between the ages of 30–33 months and analyzed by micro-computed tomography (micro CT). (A) Distal trabecular tissue mineral density (TMD) was improved in SDLR and SDR compared to SD control bones (P < 0.05 for SDLR and P < 0.01 SDR vs SD control; *). All error bars indicate s.e.m. (B) Cortical TMD tended to increase with resveratrol treatment (p = 0.14). All error bars indicate s.e.m. (C) Resveratrol significantly increased bone volume to total volume ratio over the entire femur in SD fed mice (P < 0.05 for SDLR and P < 0.01 SDR vs SD control; *), n = 5 for all groups in panels A, B, and C. All error bars indicate s.e.m. (D) Bone strength was tested in the post-mortem femurs. Resveratrol treatment caused a trend towards increased maximum load (the load that is endured by a bone prior to it failing in the three-point bending to failure test) (p = 0.18), n = 5 for SD and SDLR and n = 4 for SDR. All error bars indicate s.e.m. (E) Resveratrol treatment delayed the onset of age-related cataracts. Lens opacity was scored in living mice on a scale from 0 to 4 by half steps of 0.5, with 4 representing the complete lens opacity of a mature cataract. Age-related cataract development was significantly decreased at 30 months of age in SDR mice compared to the SD control, whereas EOD feeding caused an early protective effect that was lost (P < 0.05; *). All error bars indicate s.e.m. (F) Time to fall from an accelerating rotarod was measured every 3 months for all survivors from a pre-designated subset of each group; n = 15 (SD), 11 (SDLR), and 16 (SDR). The SDR group improved significantly at 21 and 24 months vs. 15 months (P < 0.05; #), showing increased motor coordination over time. All error bars indicate s.e.m. (G) Acetylcholine-induced relaxation in aortic ring preparations. Both age-related (SD 18m vs SD 3m) and obesity-related (HC 18m vs SD 18m) declines in endothelial function were prevented by resveratrol treatment. Pre-incubation with SOD restored ACh-induced relaxation in the HC 18m rings to youthful levels, n = 6 for each group. (&P < 0.05 vs. SD 3m, *P < 0.05 vs SD 18m and #P < 0.05 vs. HC 18m). All error bars indicate s.e.m. (H) Quantification of total nuclear ethidium bromide fluorescence as a marker of increased oxidative stress, n = 6 aortas for each group. This panel combines data from two experiments shown separately in Fig. S6P and S6Q. Both age-related (SD 18m vs SD 3m) and obesity-related (HC 18m vs SD 18m) increases in oxidative stress were prevented by resveratrol treatment. (&P < 0.05 vs. SD 3m, *P < 0.05 vs. SD 18m and #P < 0.05 vs. HC 18m). All error bars indicate s.e.m. (I, J) Representative TUNEL staining of aortas from mice of the indicated ages and diets. Nuclei from apoptotic endothelial cells (intense green) in aortas of SD 18m and HC 18m mice are highlighted in insets. Autofluorescence of elastic laminae (faint green) and nuclear counterstaining (propidium iodide, red) are shown for orientation purposes. (K) Apoptotic index (% of TUNEL positive endothelial cell nuclei), was increased in the aortas of obese mice, and this change was prevented by resveratrol treatment, n = 6 aortas for each group, 10 to 15 images per aorta were analyzed. (&P < 0.05 vs. SD 3m, *P < 0.05 vs. SD 18m and #P < 0.05 vs. HC 18m). All error bars indicate s.e.m.
Figure 4
Figure 4. Effects of resveratrol treatment on longevity
(A) Mean body weights over the entire lifespan. EOD feeding lowered body weight and HC diet increased it (P < 0.001). Resveratrol did not affect body weight in mice fed the SD or EOD diets. The HCLR group was significantly heavier than the HC control group (P < 0.01), while the HCR group showed a slight trend towards decreased body weight that did not reach statistical significance. Error bars indicate s.e.m. (B) Kaplan-Meier survival analyses were performed on the SD, SDLR, and SDR groups and the curves were not significantly different by the log-rank or Wilcoxon tests. n = 60 (SD), 55 (SDLR), and 54 (SDR) at the beginning of the experiment. (C) Kaplan-Meier survival analyses were performed on the SD, EOD, EODLR, and EODR groups. There were no significant differences between the three EOD diet groups; however, the EODLR had increased survival compared to the SD control group as determined by both log-rank (χ2 = 7.46, P = 0.006) and Wilcoxon (P = 0.0016) tests. n = 60 (SD) and 55 (EOD, EODLR, and EODR) at the beginning of the experiment. (D) Kaplan-Meier survival analyses were performed on the SD, HC, HCLR, and HCR groups. The HC control group had decreased survival compared to the SD control group (log-rank: χ2 = 11.65, P = 0.0006, Wilcoxon: P = 0.0003), whereas, survival in the HCLR and HCR groups did not differ significantly from that of SD controls. When compared to HC controls, survival was significantly increased in both the HCLR group (log-rank: χ2 = 8.31, P = 0.004, Wilcoxon: P = 0.005) and the HCR group (log-rank: χ2 = 4.83, P = 0.03, Wilcoxon: P = 0.001). n = 60 (SD) and 55 (HC, HCLR, and HCR) at the beginning of the experiment. (E) Maximum lifespan was calculated as the mean of the final 20% of mice in each group as determined by Kaplan-Meier analysis. Compared to the SD control group, the maximum lifespan was significantly increased in the EODLR (P = 0.03) and significantly decreased in the HC control (P = 0.003) groups. In addition, HCLR had significantly increased maximum lifespan compared to the HC control group (P = 0.04), and there was a trend towards increased lifespan in HCR mice compared to HC controls. *,P < 0.05 vs SD control; #, P < 0.05 vs HC control. Error bars indicate s.e.m. (F) Kaplan-Meier survival analyses were performed on the SD and SDHR groups, and the curves were not significantly different. The earlier SD survival curve (broken line) is shown for reference. n = 48 (SD, SDHR), and 60 (previous SD control) at the beginning of the experiment.

References

    1. Anderson RM, Bitterman KJ, Wood JG, Medvedik O, Sinclair DA. Nicotinamide and PNC1 govern lifespan extension by calorie restriction in Saccharomyces cerevisiae. Nature. 2003;423:181–185. - PMC - PubMed
    1. Barger JL, Kayo T, Vann JM, Arias EB, Wang J, Hacker TA, Wang Y, Raederstorff D, Morrow JD, Leeuwenburgh C, Allison DB, Saupe KW, Cartee GD, Weindruch R, Prolla TA. A low dose of dietary resveratrol partially mimics caloric restriction and retards aging parameters in mice. PLoS ONE. 2008;3:e2264. - PMC - PubMed
    1. Barger JL, Walford RL, Weindruch R. The retardation of aging by caloric restriction: its significance in the transgenic era. Exp Gerontol. 2003;38:1343–1351. - PubMed
    1. Bass TM, Weinkove D, Houthoofd K, Gems D, Partridge L. Effects of resveratrol on lifespan in Drosophila melanogaster and Caenorhabditis elegans. Mech Ageing Dev. 2007;128:546–552. - PubMed
    1. Bauer JH, Goupil S, Garber GB, Helfand SL. An accelerated assay for the identification of lifespan-extending interventions in Drosophila melanogaster. Proc Natl Acad Sci U S A. 2004;101:12980–12985. - PMC - PubMed

Publication types

MeSH terms