. 2008 Sep 1;586(17):4069-89.
doi: 10.1113/jphysiol.2008.155077. Epub 2008 Jul 3.

Vesicular apparatus, including functional calcium channels, are present in developing rodent optic nerve axons and are required for normal node of Ranvier formation

Affiliations

Vesicular apparatus, including functional calcium channels, are present in developing rodent optic nerve axons and are required for normal node of Ranvier formation

James J P Alix et al. J Physiol. .

Abstract

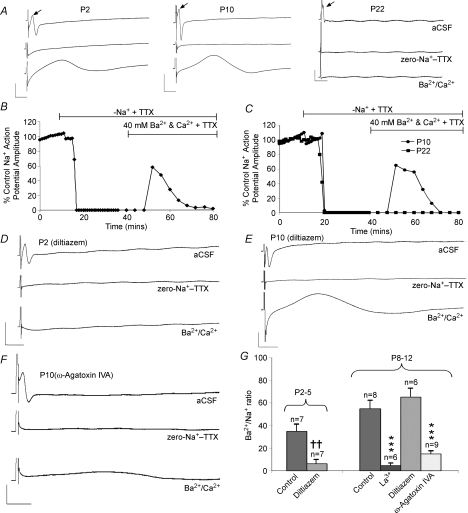
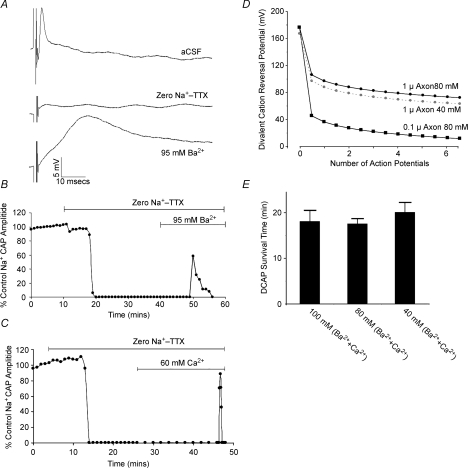
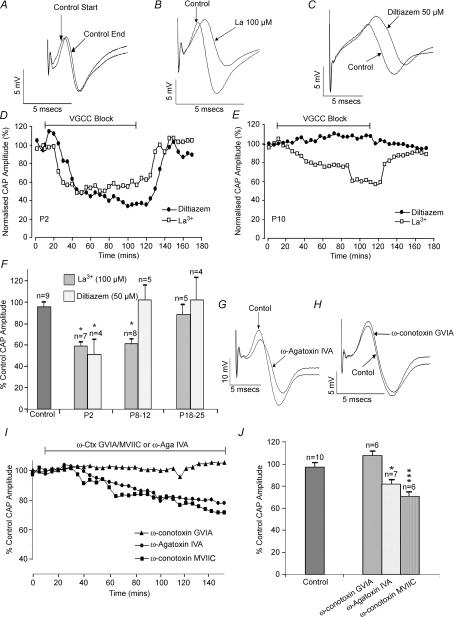
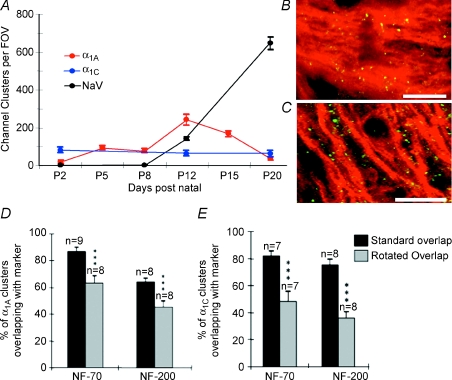
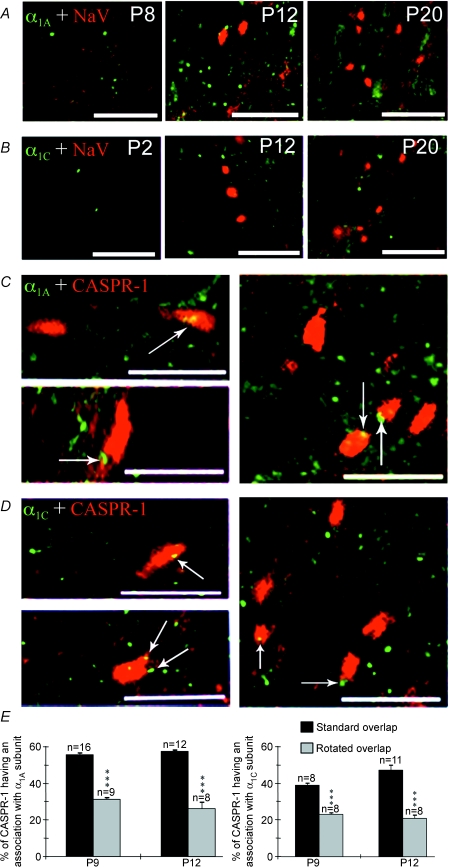
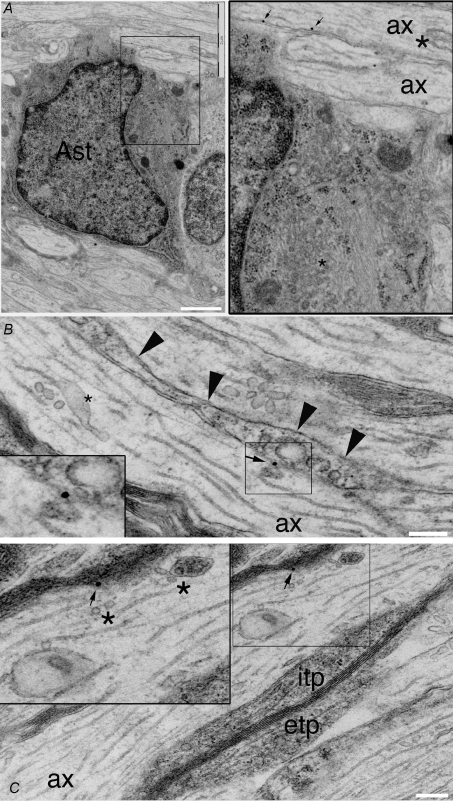
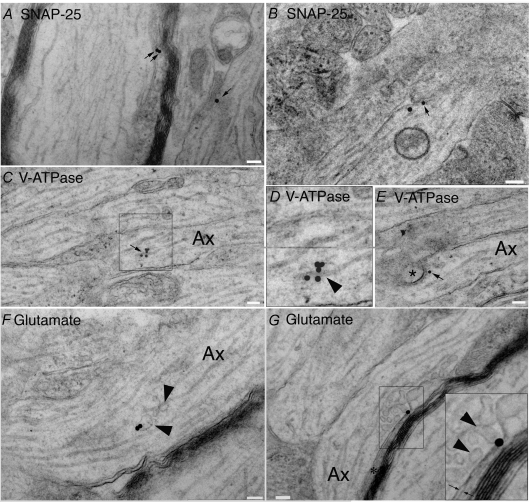
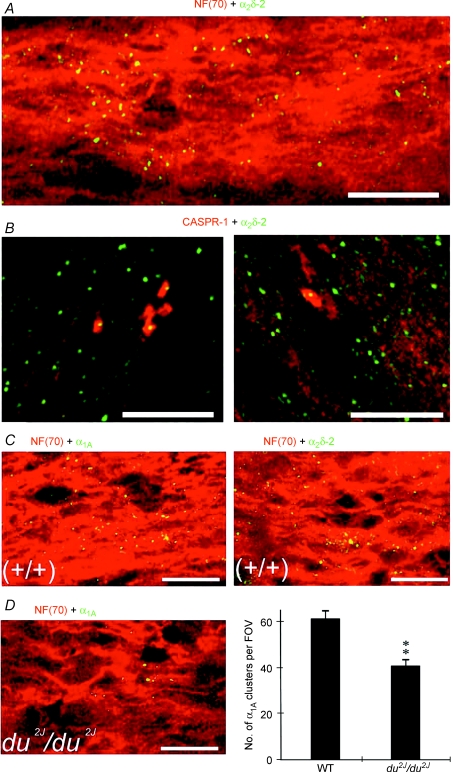
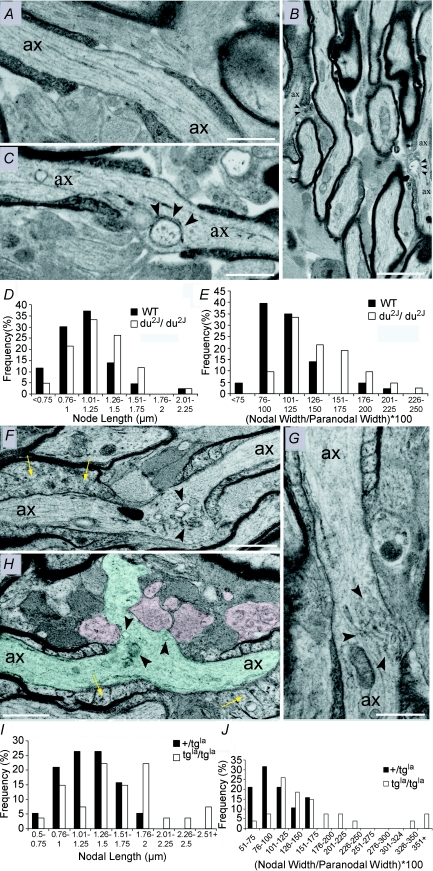
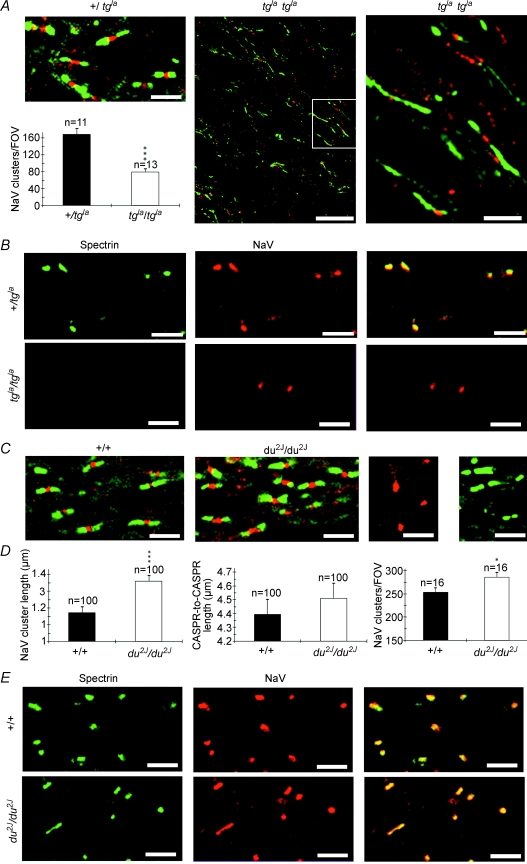
P/Q-type calcium channels are known to form clusters at the presynaptic membrane where they mediate calcium influx, triggering vesicle fusion. We now report functional P/Q channel clusters in the axolemma of developing central axons that are also associated with sites of vesicle fusion. These channels were activated by axonal action potentials and the resulting calcium influx is well suited to mediate formation of a synaptic style SNARE complex involving SNAP-25, that we show to be located on the axolemma. Vesicular elements within axons were found to be the sole repository of vesicular glutamate in developing white matter. The axonal vesicular elements expressed the glutamate transporter V-ATPase, which is responsible for vesicular glutamate loading. The P/Q channel alpha(1A) subunit was found to be present within the axolemma at early nodes of Ranvier and deleterious mutations of the alpha(1A) subunit, or an associated alpha(2)delta-2 subunit, disrupted the localization of nodal proteins such as voltage-gated sodium channels, beta IV spectrin and CASPR-1. This was associated with the presence of malformed nodes of Ranvier characterized by an accumulation of axoplasmic vesicles under the nodal membrane. The data are consistent with the presence of a vesicular signalling pathway between axons and glial cells that is essential for proper development of the node of Ranvier.


Figures

Figure 1
Figure 1. Divalent cation action potentials can be produced in neonatal rat optic nerve axons
A, compound action potentials recorded at three developmental ages. Top traces show the normal, fast-conducting, action potential (arrow, following the stimulus artefact). Middle traces show block of this action potential in zero-Na+–TTX (1 μm). Lower traces show a large amplitude, slow-conducting, action potential recorded in the presence of 40 mm of both Ba2+ and Ca2+ (still in zero-Na+–TTX). Note the absence of a divalent cation action potential at P22. B, action potential amplitude recorded at P2 versus time. Zero-Na+–TTX blocks the action potential after ∼10 min and switching to Ba2+–Ca2+ produces a divalent cation action potential after 12 min that then declines slowly. C, similar plot of action potentials at P10 and P22. D, traces of normal action potential, block in zero-Na+–TTX and perfusion with Ba2+–Ca2+ (in zero-Na+–TTX) solution at P2 in the presence of the specific L-type blocker diltiazem (50 μm). No divalent cation action potential is apparent. E, similar data at P10, showing large divalent cation action potential in diltiazem. F, experiment as above demonstrating a much reduced divalent cation action potential in the presence of ω-agatoxin IVA (100 nm). G, amplitude of the divalent cation action potential relative to normal action potential at various ages. The divalent cation action potential was blocked by diltiazem at P2–P5 but not at P8–P12. ω-Agatoxin IVA significantly blocked the divalent cation action potential at P8–P12, as did the non-selective calcium channel blocker La3+ (100 μm). Error bars are s.e.m., ***P < 0.001 versus control P8–P12, ††P < 0.01 versus control P2–P5. Scale bars are 10 mV and 10 ms.
Figure 2
Figure 2. Features of the DCAP in P8–P12 rat optic nerve
A, high concentrations of a single divalent cation can produce a DCAP. Top, a normal compound action potential recorded in aCSF. Middle, block of this action potential in zero-Na+–TTX solution. Bottom, a large-amplitude, slow-conducting DCAP is recorded in the presence of 95 mm Ba2+. B, action potential amplitude is plotted against time, demonstrating the decline in the DCAP over an ∼10 min time course. C, a similar protocol showing the time-course of a DCAP recorded in 60 mm Ca2+. Switching to zero-Na+–TTX solution produced block of the normal action potential and changing to 60 mm extracellular Ca2+ resulted in a short-lasting DCAP. D, the divalent cation reversal potential in axons calculated assuming a starting axoplasmic concentration of 100 nm, an extracellular divalent cation concentration of 90 mm, a resting membrane potential of –70 mV, a DCAP amplitude of 100 mV and a membrane capacitance of 1 μF cm−2. It is also assumed that there is no significant extrusion of divalent cations entering during the DCAP and that there is no influx into the axon when the axolemma is at rest. Given these assumptions, it is apparent that a small number of divalent cation action potentials have a dramatic affect upon the divalent cation reversal potential, in particular for the smaller diameter axons (0.1 μm, filled squares). Reducing the extracellular divalent cation concentration to 40 mm has minimal effect upon the time course of the collapse of the reversal potential (grey circles, plotted for a 1 μm axon). E, the time between the first appearance of a DCAP and its failure (survival time) in various high divalent cation conditions, showing that varying the total divalent cation concentration between 40 and 100 mm had no significant affect, as predicted in D.
Figure 3
Figure 3. Ca2+ channels contribute to normal action potentials in developing axons
A, P12 control showing the compound action potential recorded at T= 0 min (control start) and T= 150 min (control end). B, non-selective Ca2+ channel block with La3+ reduced action potential amplitude at P12. C, block of L-type channels with diltiazem at P12 did not reduce action potential amplitude (slowing is evident). D, La3+ and diltiazem produced a similar, reversible, decline in the compound action potential at P2. E, La3+ but not diltiazem produced a reversible decline in the action potential at P10. F, summary showing the effect of La3+ and diltiazem upon compound action potential amplitude at different ages. G, block of P/Q-type channels with ω-agatoxin IVA (100 nm) reduced action potential amplitude at P12. H, block of N-type channels with ω-conotoxin GVIA (1 μm) had no significant affect at P12. I, time course of effect of ω-agatoxin IVA, ω-conotoxin GVIA and ω-conotoxin MVIIC on action potential amplitude at P12. J, summary of the effects of ω-agatoxin IVA or ω-conotoxins upon action potential amplitude at P12. *P < 0.05, ***P < 0.001.
Figure 4
Figure 4. The evolution of ion channel clusters in optic nerve during development
A, the density of sodium channel (black), α1A (red) and α1C (blue) clusters during development. B, α1A subunits (green) are clustered on NF-70(+) axons (red). C, few α1A subunits (green) co-localized with CNPase(+) oligodendroglia (red). Some overlap is seen due to the close apposition of axons and myelinating oligodendrocyte processes. Scale bars, 10 μm. D and E, rotating the NF-70 and NF-200 images by 90 deg significantly reduced the degree of co-localization, indicating a greater association than would be due to chance. A relatively high degree of association was still observed due to the ubiquitous nature of neurofilament staining. ***P < 0.001.
Figure 5
Figure 5. Voltage-gated Ca2+ channel clusters on developing central axons are precursors of nodes of Ranvier
A, α1A subunits (green) are present in clusters in P2 optic nerve, increase in number at P12 but are largely absent at P20 (although diffuse staining remains). Na+ channels (NaV) clusters (red) are present at P12 and P20. B, α1C subunits (green) are present at a low density throughout the postnatal ages studied. NaV (red) clusters are visible at P12 and P20. C, α1A clusters (green) are associated with CASPR-1 clusters (red) at P9 (two left panels) and P12 (right panel). D, α1C clusters (green) are associated with CASPR-1 immunoreactivity (red) at P9 (two left panels) and P12 (right panel). E, rotating the CASPR-1 images by 90 deg relative to the α1A images (left) or α1C (right) significantly reduced the association between α1 and CASPR-1 clusters (***P < 0.001, normal versus rotated), indicating a greater association than would be due to chance. All scale bars, 10 μm.
Figure 6
Figure 6. α1A subunits are present on the axolemma of developing axons
A, immuno-gold labelling of α1A protein reveals gold particles on the intracellular face of the axolemma of axons in P10 rat optic nerve (arrows, shown at higher gain to the right). α1A immunoreactivity is present on an unmyelinated axon that is being contacted by an astrocyte (Ast: identified using standard ultrastructural criteria). Note the large vesiculotubular complex vacuole (asterisk) in the axon (ax). B, an unmyelinated axon (ax) with a glial process running parallel to the axolemma (arrow heads) has immuno-gold labelling of α1A protein at a point where an element of the vesiculotubular complex appears to be fusing with the axolemma (shown at higher gain in the box). A prominent component of the vesiculotubular complex present in the centre of the axon is indicated by an asterisk. C, vesicle elements of the vesiculotubular complex (asterisk) appear to be approaching and fusing with the axolemma at a point where α1A protein is detected by immuno-gold labelling (arrow). This axon is being myelinated and has prominent oligodendrocyte interior and exterior tongue processes (itp, etp). Scale bars: A, 500 nm; B and C, 200 nm.
Figure 7
Figure 7. Elements involved in vesicular docking are present in developing axons
A and B, SNAP-25 localization in P10 rat optic nerve axons detected with immuno-gold labelling. Gold particles (arrows) are concentrated on the interior face of the axolemma, in particular at regions where elements of the vesiculotubular complex are close to, or appear to have docked with, the axolemma. Note in A that gold staining is apparent both in a region where a tubular element is contacting the axolemma (left arrows) and in a region where vesicles appear to be fusing with the axolemma (right arrow). Note in B that a large axoplasmic vesicle is apposed to a region with two gold particles on the axolemma (compare this micrograph with E below). C–E, V-ATPase is densely expressed in elements of the vesiculotubular complex. Note in C the intense gold labelling of a tubular element, shown in greater magnification in D (box) indicated by an arrow head and having a diameter and morphology that distinguishes it from a microtubule. Note in E that staining is apparent on what appears to be a large vesicle in the process of fusing with the axolemma. F, glutamate reactivity in a vesicular element of the vesiculotubular complex (arrowheads). G, glutamate reactivity in vesicular elements of the vesiculotubular complex (arrow heads) that are in the process of fusing with the axolemma, as shown at higher magnification in the box where vesicular and axolemma membranes can be seen to be contiguous. The vesicles are fusing in an area tightly apposed to a glial process (asterisk) and the immuno-gold particle is located in the extracellular space where the vesicles contents are likely to be released (arrows). Scale bar, 100 nm throughout.
Figure 8
Figure 8. α2δ-2 subunits are present in clusters on developing central axons
A, α2δ-2 (green) and NF-70 (red) expression in P12 rat optic nerve. Note that α2δ-2 clusters are present along NF-70 axons. B, α2δ-2 clusters (green) are associated with CASPR-1 clusters (red) in P9 (left) and P12 (right) rat optic nerve. C, α1A (green, left) and α2δ-2 (green, right) co-localize with NF-70+) axons (red) in P9+/+ mouse optic nerve. D, fewer α1A clusters (left, green) are apparent in axons (red) in the du2J mouse, which was statistically significant (right). **P < 0.01. Scale bars, 10 μm.
Figure 9
Figure 9. Ultrastructural correlates of P/Q channel dysfunction in developing central axons
A–E, du2J/du2J, F–J, tgla/tgla. A, long-section of a P25+/+ optic nerve axon (ax) showing a typical node of Ranvier. Note the normal nodal membrane that separates the myelin end-loops and the typical appearance of the nodal and paranodal glial processes. B, two nodes are present in this lower power micrograph of P25 du2J/du2J optic nerve. In both cases, vacuoles of various sizes are present in the nodal axoplasm (arrow heads). C, long section of a node from P25 du2J/du2J optic nerve. Note the presence of large vacuoles within the nodal axoplasm adjacent to the axolemma (indicated by arrowheads). D, comparison of the node length in +/+ (WT) and du2J/du2J optic nerve. E, comparison of the node diameter ((node width/paranodal width) × (100) in +/+ and du2J/du2J. F and G, long sections of nodes of Ranvier in tgla/tgla. Note the presence of vacuoles of various sizes and shapes within the nodal axoplasm (arrowheads). The nodal axolemma was generally wider in the mutant and in some cases had become extruded into the extra-nodal space (H, axon shaded blue). Paranodal glial processes were often abnormal (e.g. H: shaded red), and paranodal end loops appeared swollen in places (yellow arrows). I, comparison of the node length in +/tgla and tgla/tgla optic nerve. J, comparison of the node diameter in +/tgla and tgla/tgla. Scale bars: A, C, F and G, 2 μm; B, 5 μm.
Figure 10
Figure 10. P/Q channel dysfunction is associated with a disruption in the localization of nodal proteins
A and B, tgla/tgla; C–E, du2J/du2J. A, top, left: NaV (red) and CASPR-1 (green) localization in control (+/tgla) optic nerve. Bottom, left: the density of NaV clusters is significantly lower in tgla/tgla optic nerve than in +/tgla. Middle: NaV (red) and CASPR-1 (green) localization in tgla/tgla optic nerve. Note the grossly elongated regions of CASPR-1 localization and the sparse, ectopic nature of the NaV clusters (the box is shown in higher magnification to the right). B, β IV-spectrin (green) and NaV (red) clusters are co-localized in control (+/tgla) optic nerve (top) but no β IV-spectrin reactivity is found in tgla/tgla optic nerve (bottom). Overlaid images are shown to the right. C, left, NaV (red) and CASPR-1 (green) localization in control (+/+) optic nerve. Middle: NaV (red) and CASPR-1 localization in du2J/du2J optic nerve. Note the similarity in the staining patterns. Right: two control images showing the absence of CASPR-1 reactivity when the CASPR-1 antibody is omitted from the staining protocol (red, NaV staining remains), and the absence of NaV reactivity when the NaV antibody is omitted from the staining protocol (green, CASPR-1 staining remains). D, the length of NaV clusters (left), the distance between CASPR-1 clusters at nodes (middle, measured from the juxta-paranodal end of one CASPR-1 cluster to the juxta-paranodal end of its companion cluster), and the density of NaV clusters (right) in +/+ and du2J/du2J optic nerve. E, spectrin (green) and NaV (red) staining is co-localized in both +/+ (top) and du2J/du2J (bottom) optic nerve. Overlaid images are shown to the right. *P < 0.05, ***P < 0.001. Scale bars, all 5 μm, apart from middle panel in A, 20 μm.

References

    1. Aidley DJ. The Physiology of Excitable Cells. Cambridge: Cambridge University Press; 1971.
    1. Armstrong CM, Cota G. Calcium block of Na+ channels and its effect on closing rate. Proc Natl Acad Sci U S A. 1999;96:4154–4157. - PMC - PubMed
    1. Arroyo EJ, Xu T, Grinspan J, Lambert S, Levinson SR, Brophy PJ, Peles E, Scherer SS. Genetic dysmyelination alters the molecular architecture of the nodal region. J Neurosci. 2002;22:1726–1737. - PMC - PubMed
    1. Back SA, Craig A, Kayton RJ, Luo NL, Meshul CK, Allcock N, Fern R. Hypoxia-ischemia preferentially triggers glutamate depletion from oligodendroglia and axons in perinatal cerebral white matter. J Cereb Blood Flow Metab. 2006;27:334–347. - PubMed
    1. Back SA, Rivkees SA. Emerging concepts in periventricular white matter injury. Semin Perinatol. 2004;28:405–414. - PubMed

Publication types

LinkOut - more resources