. 2008 Sep 1;586(17):4265-82.
doi: 10.1113/jphysiol.2008.152108. Epub 2008 Jul 3.

Pontine respiratory-modulated activity before and after vagotomy in decerebrate cats

Affiliations

Pontine respiratory-modulated activity before and after vagotomy in decerebrate cats

Thomas E Dick et al. J Physiol. .

Erratum in

  • J Physiol. 2008 Nov 1;586(21):5279

Abstract

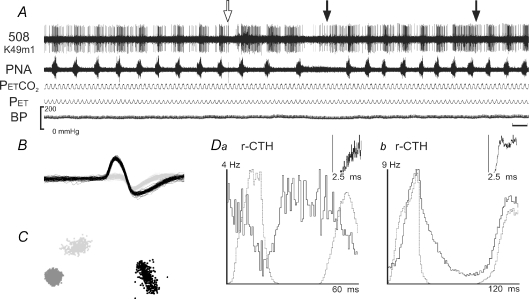
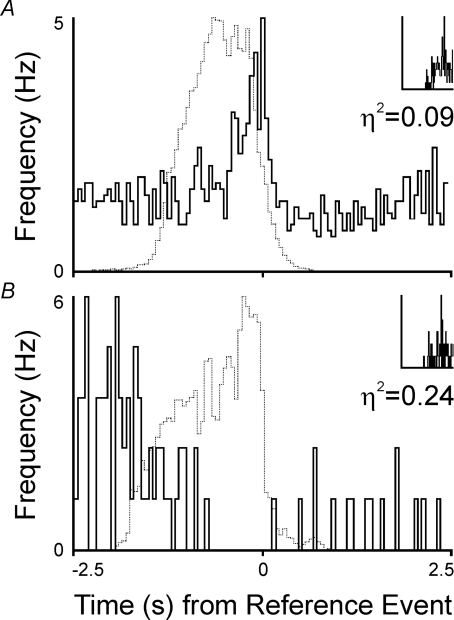
The dorsolateral (DL) pons modulates the respiratory pattern. With the prevention of lung inflation during central inspiratory phase (no-inflation (no-I or delayed-I) tests), DL pontine neuronal activity increased the strength and consistency of its respiratory modulation, properties measured statistically by the eta(2) value. This increase could result from enhanced respiratory-modulated drive arising from the medulla normally gated by vagal activity. We hypothesized that DL pontine activity during delayed-I tests would be comparable to that following vagotomy. Ensemble recordings of neuronal activity were obtained before and after vagotomy and during delayed-I tests in decerebrate, paralysed and ventilated cats. In general, changes in activity pattern during the delayed-I tests were similar to those after vagotomy, with the exception of firing-rate differences at the inspiratory-expiratory phase transition. Even activity that was respiratory-modulated with the vagi intact became more modulated while withholding lung inflation and following vagotomy. Furthermore, we recorded activity that was excited by lung inflation as well as changes that persisted past the stimulus cycle. Computer simulations of a recurrent inhibitory neural network model account not only for enhanced respiratory modulation with vagotomy but also the varied activities observed with the vagi intact. We conclude that (a) DL pontine neurones receive both vagal-dependent excitatory inputs and central respiratory drive; (b) even though changes in pontine activity are transient, they can persist after no-I tests whether or not changes in the respiratory pattern occur in the subsequent cycles; and (c) models of respiratory control should depict a recurrent inhibitory circuitry, which can act to maintain the stability and provide plasticity to the respiratory pattern.


Figures

Figure 6
Figure 6. Changes in discharge frequencies(y-axis: A, mean, and B, peak) and in η2 values (x-axis) for pontine activity before and after vagotomy
A and B, lines join pairs of before and after recordings; continous lines indicate an increase in both firing frequency and η2 values. The activity of only one unit had minimal change with vagotomy. A, the difference in mean activity before and after vagotomy was plotted against the difference in η2 values for the 32 recordings that had an I-Aug pattern after vagotomy. B, the difference in peak activity before and after vagotomy was plotted because slowing in respiratory rate as well as increase in modulation may affect the nadir of tonic activity which may mask an increased drive. However, even the peak frequency of 4 of 32 recordings decreased rather than increased after vagotomy.
Figure 1
Figure 1. Identifying pontine ‘single-unit’ activity
A, the signal-to-noise ratio of recorded action potentials (top or 1st tracing) was stable before, during and after vagotomy. Prior to the start of the displayed tracings, the animal was switched from cycle-triggered to ‘free-run’ ventilation. Thus at the start of the record, the ventilator's rate was independent of and faster than bursts of phrenic nerve activity (PNA, 2nd tracing), as evident in the tracings of end-tidal partial pressure of carbon dioxide (PET,CO2, 3rd tracing) and of endotrachial pressure (PET, 4th tracing). The sequential steps of the vagotomy were: an electrical artefact occurred when the surgical scissors contacted the animal (open arrow), left vagus transected (first filled arrow), and the contralateral vagus was cut (second filled arrow). The arterial blood pressure (BP, bottom tracing) changed minimally during the vagotomy. B, action potential waveforms (black and grey) were overlaid at high speed (tracing length 2 ms). The waveform profiles did not change during the vagotomy. C, cluster analysis of the waveform profiles was based on 64 variables. These variables were projected and displayed in 2-dimensional space. Noise was displayed as a round tight cluster located on the left (dark grey) and the characteristics of the large action potential on the right (black) and of the small one (light grey). The clusters of the action potentials were distinguishable from noise and each other. D, both phrenic and pontine neuronal activity patterns changed after vagotomy. The auto-correlogram is shown above the cycle-triggered histogram. Da, before vagotomy and on cycle-triggered pump, activity decreased during the IE-phase transition. Db, after vagotomy, activity increased during the IE-phase transition.
Figure 8
Figure 8. Short-term plasticity of pontine activity following no-inflation test
Cycle-triggered average of a pontine neurone that was recruited in inspiration when LI was withheld (black arrow). In the subsequent cycle, activity was greater than that in the cycle previous to the no-I test (grey arrow). This neurone expressed essentially the same amount of activity in E whether or not LI was withheld. Raw recording for this example is shown in Fig. 1.
Figure 4
Figure 4. Recording of pontine neural activity immediately before, during and after vagotomy
A, two units (506 and 514) of ensemble recording had bursts during the procedure whereas others did not change their firing patterns. Dashed red line: start of the vagotomy. B, immediately following vagotomy (approximately 40 s from dashed line in A). Relative spike heights and signal-to-noise ratios were comparable to those immediately before the vagotomy, indicating the stability of the recording. C, these units were modulated with respiration before and after vagotomy. Left: respiratory cycle-triggered histograms (rCTHs) were obtained from the portion of the recording during which the animal was ventilated by a cycle-triggered pump. Right: in most (6 of 7) cases, respiratory modulation of unit activity increased immediately following vagotomy. In addition to the increase in respiratory modulation of the activity pattern, peak firing rate of activity increased in recordings 506, 510, 516 and 520.
Figure 2
Figure 2. Phase duration but not heart rate increased with vagotomy
A, both TI (open bar) and TE (filled bar) increased significantly after vagotomy (significance noted by crosses beside standard deviation bars). The percentage increase for TE was significantly greater than that for TI (significance noted by star between standard deviation bars). B, heart rate did not change significantly following vagotomy even after separating those heart beats that occurred during inspiration (HBI, open bar) from expiration (HBE, filled bar).
Figure 3
Figure 3. Three-dimensional reconstruction of location of the recording electrodes
Activity was recorded from electrode tips located in the DL pons. Distribution of recorded neurones with the vagi intact (left) and transected (right) is shown. The ‘respiratoriness’ or magnitude of the η2 value is portrayed using a colour progression, with nonrespiratory-modulated activity shown as dark blue and respiratory-modulated activity with an η2 value of 1.0 as bright red. The topography of multiple sections is superimposed to form an outline of the brainstem with the dark centre being the caudal medullary section. No preferential distribution of activity patterns was apparent.
Figure 7
Figure 7. Pontine activity during cough elicited by no-inflation (no-I) test
A, raw activity recording (1st tracing) of a pontine neurone before, during and after a no-I test (filled bar between 3rd and 4th tracings). The animal was ventilated with a cycle-triggered pump, which initiates lung inflation (LI) with the onset of phrenic nerve activity (PNA, 2nd tracing). A decrease in expired partial pressure of carbon dioxide (PET,CO2, 3rd tracing) and an increase in endotracheal pressure (PET, 4th tracing) varied with LI. In the first two respiratory cycles when LI occurred, activity started during expiration (E), increased progressively, paused at the beginning of inspiration (I) then returned at the end of I. When LI was withheld (3rd cycle), activity was absent at the end of I and was delayed and diminished at the end of E. Further, similar effects were apparent in the next two cycles. In the breath immediately after no-I, PNA activity was augmented and lumbar motoneurones were activated (not shown); thus it appeared that a cough was evoked. B, cycle-triggered average of this neurone's activity. Neural activity (continuous line) and PNA (dashed line) are averaged for 10 s before and after the reference point (0 s), which is the IE phase transition in the respiratory cycle in which LI was withheld (continuous line). With LI (1st cycle), this neurone appeared as a low-η2 cell with a value of 0.09. Its peak activity occurred at the ends of E and I. During the no-I test (continuous horizontal line), pontine activity was quiescent during I (black arrow) and suppressed in the E phase (grey arrow). Activity was also suppressed in the subsequent I phase. Although there were 40 no-I cycles, data from only 19 no-I cycles were averaged because this cell had become quiescent. C, purity of discrimination for this small amplitude recording. a, stability of the action potential waveform was determined by accumulating high-speed traces of recording (duration of the sweep is 12.5 ms). The nadir of the identified accepted action potentials were aligned. b, autocorrelograms were generated for every recording. These had to have an interval from the origin in which no spikes occurred. c, cluster analysis, a 2-dimensional projection from a 64 dimensional space (i.e. each data point from the digital recording) of each accepted waveform was plotted (dark spots) on representation and compared to background (grey spots). Distinguishable clusters that do not overlap indicated a single unit.
Figure 5
Figure 5. Distribution of activity before (A) and after (B) vagotomy
Aa, with the vagi intact, activity was primarily non-respiratory-modulated (NRM). The second-most common type of activity had a significant feature spanning the inspiratory-to-expiratory phases (IE PS) in its rCTH. Inspiratory (I), expiratory (E) and expiratory-inspiratory phase-spanning (EI PS) activities were recorded also. Ab, distribution of respiratory-modulated activity (n= 56) before vagotomy included tonic activity whose primary feature was a depression (Department) in activity. With the IE PS subtype, activity could either peak or decrease at the phase transition between inspiration and expiration. The numbers of I-Aug, IE PS, and IE PS Department subtypes are identified in the figure; the other n values are: n= 4 for I Dec; 3 I Department; 3 I Other, 2 E Aug; 2 E Dec; 5 E Other; 2 EI PS; 1 EI Department. Ba, after vagotomy, the numbers of NRM and IE PS subtypes decreased and mostly I neurones were recorded. Bb, the prevalent I-type of activity was I-Aug. No I-Department neurones were recorded after vagotomy, i.e. no tonic activity which had a significant feature of a decrease in activity during I. Further, only two late-recruited I neurones (I-LR) were recorded after vagotomy; this may be high-threshold I-Aug neurone. The other n values are: n= 2 for I Dec; 6 I Other, 4 E Aug; 4 E Dec; 5 E Other; 2 E LR; 6 EI PS; 3 EI Department.
Figure 9
Figure 9. Comparison of activity patterns of non-respiratory-modulated pontine neural activity before (left) and after (right) bilateral vagotomy as well as comparison of activity patterns during delayed lung-inflation (no-I) test (centre)
Cycle-triggered histograms (CTHs) were constructed to compare the average activity pattern during phrenic-triggered ventilation with the vagi intact, the delayed-I test and after vagotomy. During phrenic-triggered ventilation these neurones, although spontaneously active, were not modulated by lung inflation or central respiratory drive. During the delayed-I test and after vagotomy, their activity became significantly modulated with respiration and their η2 values became significant. The general features of the activity pattern were the same during delayed-I and after vagotomy with the exception of activity at the IE phase transition.
Figure 10
Figure 10. Model circuit with tonic neurone population receiving inspiratory efference copy and recurrent inhibition, simulation results and gravity analysis
A, ‘ball and stick’ diagram of simulated recurrent inhibitory circuit. The antecedent network elements that generated the augmenting inspiratory burst of the I-Aug population are not illustrated. The three circles represent simulated populations of I-Aug, recurrent inhibitory, and ‘tonic’ neurones, respectively (see Table 1); synaptic connection parameters (Table 2) were tuned so that the aggregate tonic population firing rate was approximately uniform throughout the respiratory cycle. B, stack of respiratory cycle-triggered histograms for 16 tonic model neurones and a ‘control’ neurone, which received excitation only (back histogram); 136 cycles averaged. These results show that the relative levels of excitation and inhibition at individual tonic neurones varied, and that the average activity of subsets of neurones was greater in one respiratory phase or the other. C, revised ball and stick diagram. Variations in distributions of inspiratory excitation and recurrent inhibition resulted in a variety of firing patterns, including those without respiratory modulation that became modulated when the balance was shifted with simulated vagotomy. D, simulated spike trains. Simulated spike trains were segmented into ‘time chunks’ of inspiratory and expiratory phases and concatenated with an interval equal to four times the gravity charge kernel time constant inserted between chunks. E, gravity analysis of phase-segmented spike data from model recurrent inhibitory circuit. Comparison of the two corresponding sets of particle distance as a function of time (PDFT) plots for all the constituent pairs of the 16 tonic neurones in B showed more particle pair aggregation for the inspiratory phase data. The tops of the columns show PDFT plots for concatenated inspiratory and expiratory phase spike times from model neurones 6 and 10, which exhibited no respiratory modulation of their firing rates. The bold line documents significant condensation of the particles corresponding to the neurone pair; interparticle distances achieved were less than the minimum distances between particles in 100 control surrogate data sets only for the concatenated inspiratory segments (Monte Carlo confidence limits, Lindsey et al. 1992c). The filled regions of each row in the array below the plots indicate times when the distance between the represented pair of particles was less than expected by chance during the gravity run. Numbers of spikes, 1: 2695; 2: 2318; 3: 2713; 4: 1499; 5: 336; 6: 1675; 7: 1130; 8: 1547; 9: 1757; 10: 1444; 11: 1501; 12: 200; 13: 1162; 14: 1845; 15: 1315; 16: 905. The right column shows results for the concatenated expiratory spike times. No significant aggregation was detected for neurone pair 10–6; significant synchrony during expiration was less frequent than during inspiration among the other represented spike train pairs. Numbers of spikes, 1: 1611; 2: 1585; 3: 1602; 4: 1572; 5: 1630; 6: 1563; 7: 1564; 8: 1568; 9: 1553; 10: 1614; 11: 1577; 12: 1572; 13: 1557; 14: 1599; 15: 1598; 16: 1581. Gravity parameters: charge kernel time constant 5.0 ms; acceptor and effector charges forward.
Figure 11
Figure 11. Comparison of simulated and in vivo data
A and B, respiratory cycle-triggered histograms for two neurones recorded simultaneously. Model (above) and in vivo (below) neurones before (left) and after (right) vagotomy (in vivo) or loss of PSR feedback (simulations). In A, activity increases, whereas in B, it decreases after vagotomy. See text.

References

    1. Alheid GF, Milsom WK, McCrimmon DR. Pontine influences on breathing: an overview. Respir Physiol Neurobiol. 2004;143:105–114. - PubMed
    1. Baekey DM, Morris KF, Gestreau C, Li Z, Lindsey BG, Shannon R. Medullary respiratory neurones and control of laryngeal motoneurones during fictive eupnoea and cough in the cat. J Physiol. 2001;534:565–581. - PMC - PubMed
    1. Baekey DM, Morris KF, Nuding S, Segers LS, Lindsey BG, Shannon R. Ventrolateral medullary respiratory network participation in the expiration reflex in the cat. J Appl Physiol. 2004;96:2057–2072. - PubMed
    1. Balis UJ, Morris KF, Koleski J, Lindsey BG. Simulations of a ventrolateral medullary neural network for respiratory rhythmogenesis inferred from spike train cross-correlation. Biol Cybern. 1994;70:311–327. - PubMed
    1. Berman AL. The Brain Stem of the Cat: A Cytoarchitectonic Atlas with Stereotaxic Coordinates. Madison: University of Wisconsin Press; 1968.

Publication types

LinkOut - more resources