Comparative Study
. 2008 Sep;148(1):504-18.
doi: 10.1104/pp.108.119222. Epub 2008 Jul 3.

In-depth investigation of the soybean seed-filling proteome and comparison with a parallel study of rapeseed

Affiliations
Comparative Study

In-depth investigation of the soybean seed-filling proteome and comparison with a parallel study of rapeseed

Ganesh Kumar Agrawal et al. Plant Physiol. 2008 Sep.

Abstract

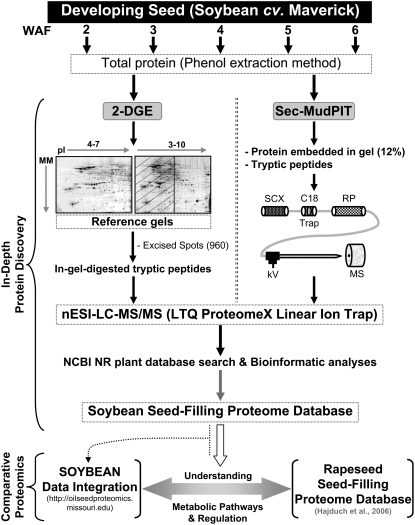
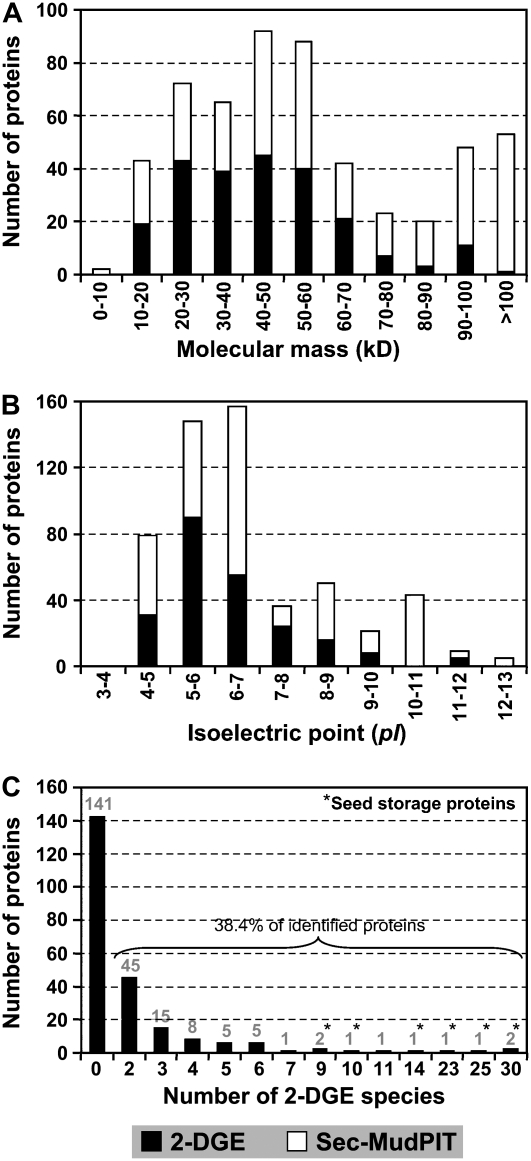
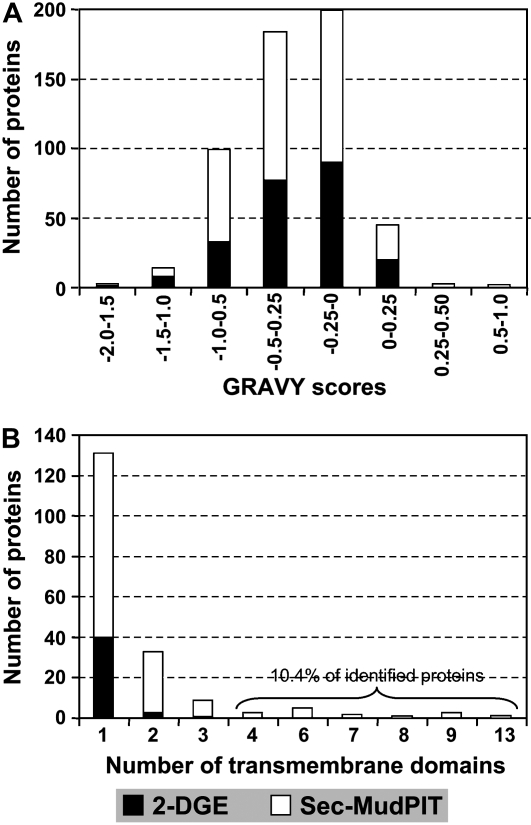
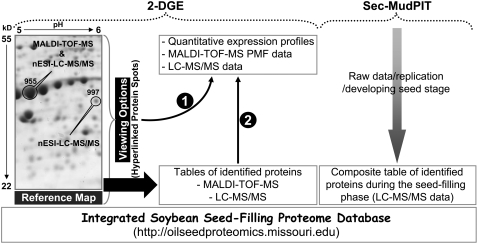
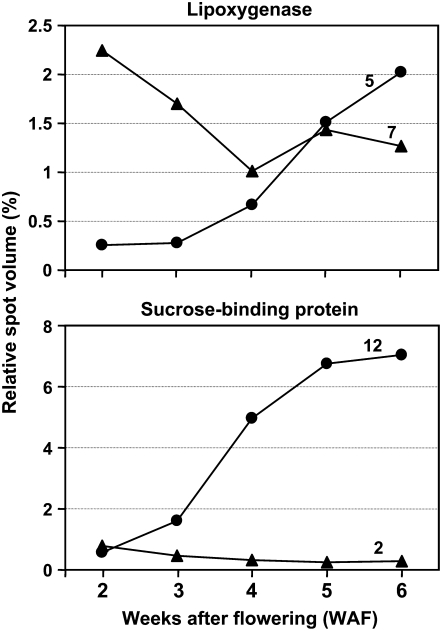
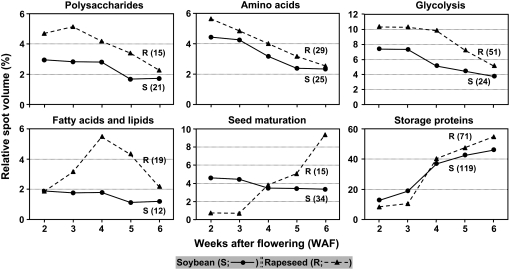
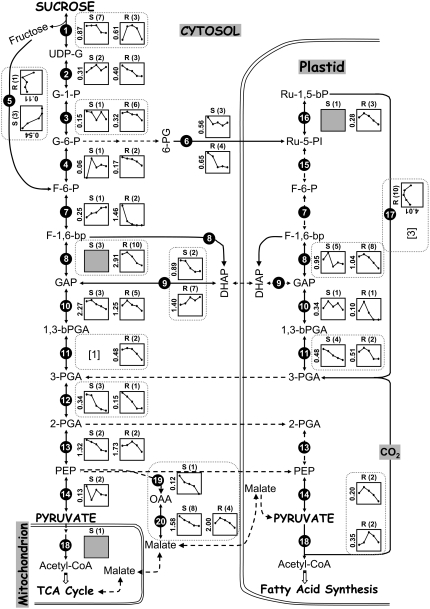
To better understand the metabolic processes of seed filling in soybean (Glycine max), two complementary proteomic approaches, two-dimensional gel electrophoresis (2-DGE) and semicontinuous multidimensional protein identification technology (Sec-MudPIT) coupled with liquid chromatography-mass spectrometry, were employed to analyze whole seed proteins at five developmental stages. 2-DGE and Sec-MudPIT analyses collectively identified 478 nonredundant proteins with only 70 proteins common to both datasets. 2-DGE data revealed that 38% of identified proteins were represented by multiple 2-DGE species. Identified proteins belonged to 13 (2-DGE) and 15 (Sec-MudPIT) functional classes. Proteins involved in metabolism, protein destination and storage, and energy were highly represented, collectively accounting for 61.1% (2-DGE) and 42.2% (Sec-MudPIT) of total identified proteins. Membrane proteins, based upon transmembrane predictions, were 3-fold more prominent in Sec-MudPIT than 2-DGE. Data were integrated into an existing soybean proteome database (www.oilseedproteomics.missouri.edu). The integrated quantitative soybean database was compared to a parallel study of rapeseed (Brassica napus) to further understand the regulation of intermediary metabolism in protein-rich versus oil-rich seeds. Comparative analyses revealed (1) up to 3-fold higher expression of fatty acid biosynthetic proteins during seed filling in rapeseed compared to soybean; and (2) approximately a 48% higher number of protein species and a net 80% higher protein abundance for carbon assimilatory and glycolytic pathways leading to fatty acid synthesis in rapeseed versus soybean. Increased expression of glycolytic and fatty acid biosynthetic proteins in rapeseed compared to soybean suggests that a possible mechanistic basis for higher oil in rapeseed involves the concerted commitment of hexoses to glycolysis and eventual de novo fatty acid synthesis pathways.


Figures

Figure 1.
Figure 1.
Schematic illustration of proteomics strategy includes establishment of a detailed soybean proteome database and comparison with a parallel study of rapeseed. 2-DGE and Sec-MudPIT complementary approaches were used for in-depth investigation of proteins, both quantification and identification, expressed during seed filling in soybean. 2-D reference gels were obtained by pooling equal amounts (0.2 mg) of protein sample from each of the five developmental stages studied. In the case of reference gel (pH 3–10), protein spots were excised only from the pH range 7 to 10. In Sec-MudPIT analyses, whole seed proteins isolated from three independent biological samples of the same developmental stage were used to carry out three independent Sec-MudPIT analyses. The nESI-LC-MS/MS-acquired data were searched against NCBI NR plant databases. Integrated quantitative soybean proteomic datasets were used to perform a comparative proteomics analysis with a parallel study of rapeseed. SCX, Strong cation exchange chromatography.
Figure 2.
Figure 2.
Biochemical properties of soybean proteins expressed during seed development. Theoretical molecular masses and pIs of proteins identified by 2-DGE and Sec-MudPIT were used for comparative analysis. Results presented in A and B are based on NR proteins. A, Molecular mass distribution over 10-kD increments of proteins identified by 2-DGE and Sec-MudPIT. B, Distribution of proteins versus pI. C, Distribution of 2-DGES of proteins identified by 2-DGE. Total number of proteins possessing multiple 2-DGES is mentioned on the top of each bar. SSPs are marked by asterisks.
Figure 3.
Figure 3.
Distribution of hydrophobicity and TMDs of identified soybean proteins. Distribution is based on NR proteins. A, Distribution of proteins by hydrophobicity. The GRAVY value (http://bioinformatics.org/sms2/protein_gravy.html) was calculated as described previously (Kyte and Doolittle, 1982). B, Number of predicted TMDs identified in proteins as determined by the THUMBUP method (http://sparks.informatics.iupui.edu/Softwares-Services_files/thumbup.html).
Figure 4.
Figure 4.
Architecture of the expanded soybean seed-filling proteome Web database. The displayed 2-D gel is an expanded area of the high-resolution reference map (pH 4–7) corresponding to pH 5 to 6 and molecular mass 22 to 55 kD, where protein spots 955 and 997 identified by MALDI-TOF-MS and nESI-LC-MS/MS and nESI-LC-MS/MS, respectively, are displayed. Details are described in the text.
Figure 5.
Figure 5.
Nonhierarchical clustering of LOX and SBP composite expression profiles. These composite expression profiles were generated using the 2-DGE derived total protein spot abundance dataset after normalization and subtraction of SSPs. A total of 12 and 14 protein spots identified as LOXs or SBPs, respectively, by nESI-LC-MS/MS (this study) and MALDI-TOF-MS (previous study; Hajduch et al., 2005) were used to generate composite expression profiles. Total number of protein spots grouped together to form an expression profile is given. The composite expression profile is the sum of the relative spot volume at each of the five developmental stages of seed filling of all 2-DGES.
Figure 6.
Figure 6.
A general overview of 2-DGE composite expression trends of a particular set of proteins involved in synthesis of carbohydrate, protein, and fatty acid in soybean and comparison with a parallel study of rapeseed. Composite expression profiles were created using the 2-DGE-derived total protein spot abundance dataset after normalization and subtraction of SSPs, except for storage proteins where no subtraction of SSPs was performed. S and R represent soybean (solid line) and rapeseed (dashed line), respectively. Number in parentheses is the total number of 2-DGE protein spots observed by nESI-LC-MS/MS (this study) and MALDI-TOF-MS (previous study; Hajduch et al., 2005) and summed for the expression trend.
Figure 7.
Figure 7.
Comparative proteomics view of carbon assimilatory and glycolytic pathways leading to fatty acid synthesis in soybean and rapeseed reveals apparent differences in enzyme abundance, number of 2-DGES, and expression trends. Composite expression profiles of identified enzymes in soybean (S) and rapeseed (R) are presented after normalization and subtraction of SSPs. The y-axis value is the total relative abundance of spot volume at the peak of expression. Each filled circle within the expression profile represents the developmental stage of seed filling starting at 2 WAF through 6 WAF. The total number of protein spots identified by nESI-LC-MS/MS (this study) and MALDI-TOF-MS (previous study; Hajduch et al., 2005) for a given enzyme is noted in parentheses. Absence of protein expression profiles for a given enzymatic step indicates no identification of that enzyme in either soybean or rapeseed by 2-DGE analysis. In this situation, Sec-MudPIT datasets were searched and the total number of identified enzymes is given in the bracket near each enzyme number for soybean. Shaded squares indicate that expression profiles were not obtained for those identified proteins due to either very low abundance or presence in less than three developmental stages. Broken arrows denote no identification of enzymes in soybean and rapeseed datasets. Broken boxes highlight abundance and expression profile differences between soybean and rapeseed. Abbreviations for metabolites are as defined in the text and as follows: UDP-G, uridine diphospho-Glc; G-1-P, Glc-1-P; G-6-P, Glc-6-P; 6-PG, 6-phospho-d-gluconate; F-6-P, Fru-6-P; F-1,6-bP, Fru-1,6-bisP; GAP, glyceraldehyde-3-P; DHAP, dihydroxyacetone phosphate; 1,3-bPGA, 1,3-bisphosphoglyceric acid (or 1,3-bisphosphoglycerate); PGA, phosphoglyceric acid; Ru-5-PI, ribulose-5-P; Ru-1,5-bP, ribulose-1,5-bisP.

References

    1. Agrawal GK, Thelen JJ (2006) Large scale identification and quantification profiling of phosphoproteins expressed during seed filling in oilseed rape. Mol Cell Proteomics 5 2044–2059 - PubMed
    1. Agrawal GK, Yonekura M, Iwahashi Y, Iwahashi H, Rakwal R (2005) System, trends and perspectives of proteomics in dicot plants. Part I. Technologies in proteome establishment. J Chromatogr B Analyt Technol Biomed Life Sci 815 109–123 - PubMed
    1. Andre C, Froehlich JE, Moll MR, Benning C (2007) A heteromeric plastidic pyruvate kinase complex involved in seed oil biosynthesis in Arabidopsis. Plant Cell 19 2006–2022 - PMC - PubMed
    1. Bannai H, Tamada Y, Maruyama O, Nakai K, Miyano S (2002) Extensive feature detection of N-terminal protein sorting signals. Bioinformatics 18 298–305 - PubMed
    1. Bevan M, Bancroft I, Bent E, Love K, Goodman H, Dean C, Bergkamp R, Dirkse W, Van Staveren M, Stiekema W, et al (1998) Analysis of 19 Mb of contiguous sequence from chromosome 4 of Arabidopsis thaliana. Nature 391 485–488 - PubMed

Publication types

LinkOut - more resources