. 2008 Aug;38(8):2325-36.
doi: 10.1002/eji.200838189.

The IFN-gamma-induced transcriptional program of the CIITA gene is inhibited by statins

Affiliations

The IFN-gamma-induced transcriptional program of the CIITA gene is inhibited by statins

Sun J Lee et al. Eur J Immunol. 2008 Aug.

Abstract

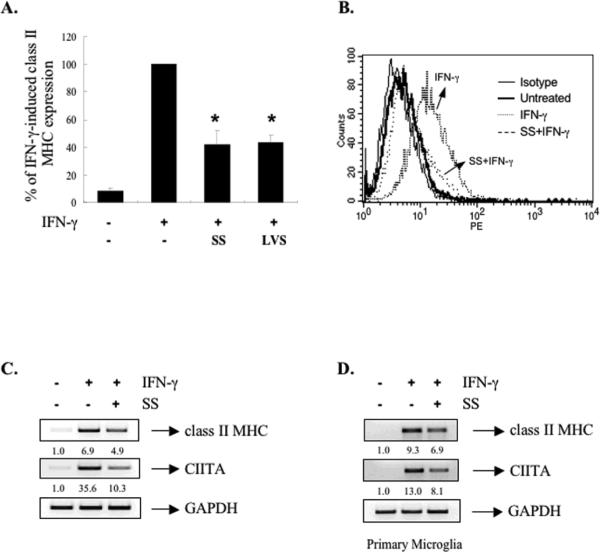
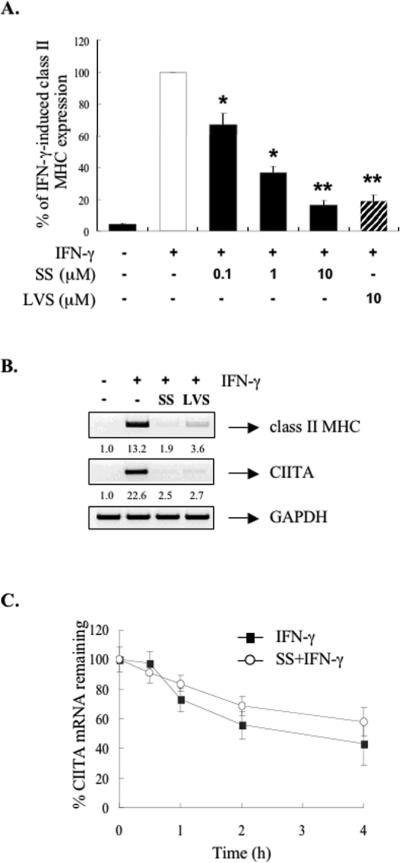
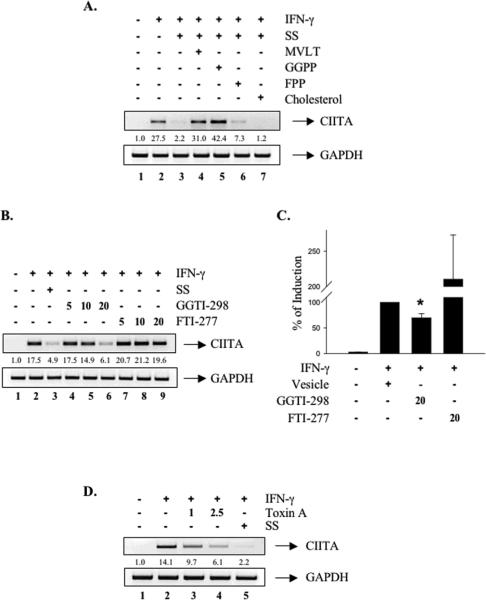
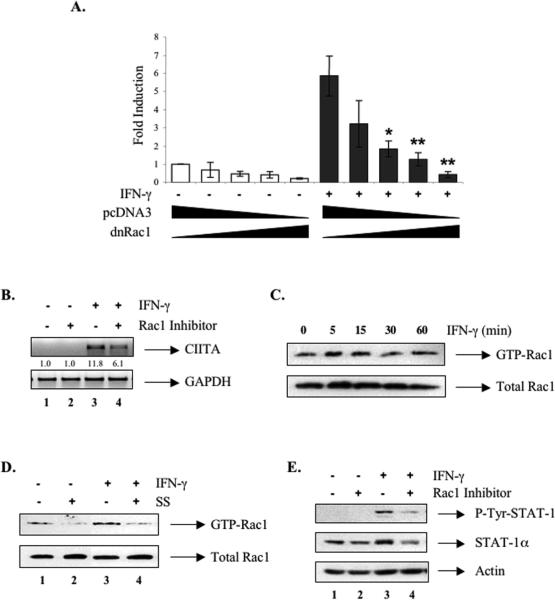
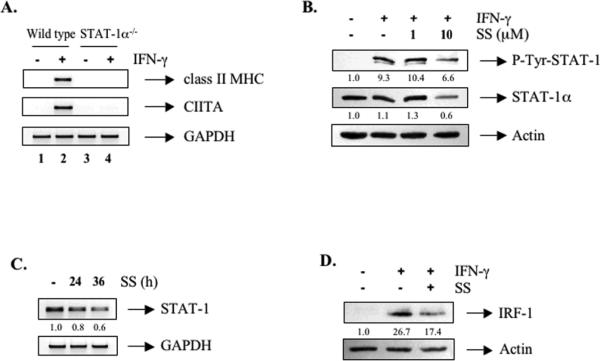
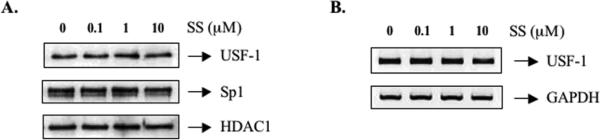
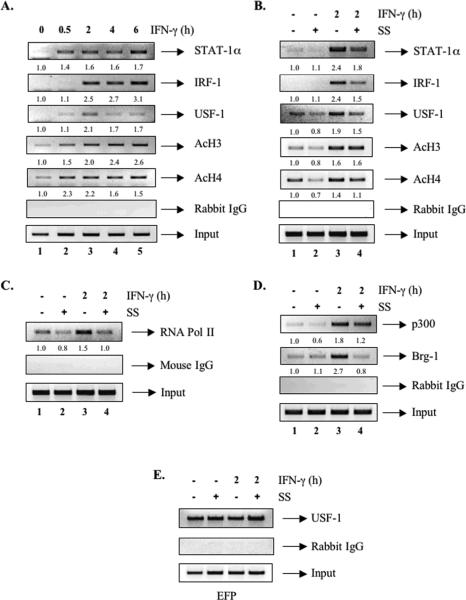
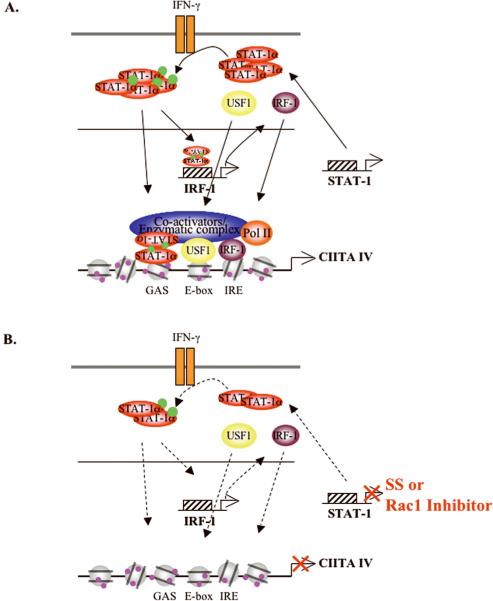
Statins are 3-hydroxy-3-methylglutaryl-coenzyme A (HMG-CoA) reductase inhibitors that exert anti-inflammatory effects. IFN-gamma induction of class II MHC expression, which requires the class II transactivator (CIITA), is inhibited by statins; however, the molecular basis for suppression is undetermined. We describe that statins inhibit IFN-gamma-induced class II MHC expression by suppressing CIITA gene expression, which is dependent on the HMG-CoA reductase pathway. In addition, CIITA expression is inhibited by GGTI-298 or Clostridium difficile Toxin A, specific inhibitors of Rho family protein prenylation, indicating the involvement of small GTPases. Rac1 is involved in IFN-gamma inducible expression of CIITA, and statins inhibit IFN-gamma-induced Rac1 activation, contributing to the inhibitory effect of statins. IFN-gamma induction of the CIITA gene is regulated by the transcription factors STAT-1alpha, interferon regulatory factor (IRF)-1 and upstream stimulatory factor (USF)-1. We previously reported that statins inhibit constitutive STAT-1alpha expression. IRF-1, a STAT-1 dependent gene, is also inhibited by statins. Therefore, statin treatment results in decreased recruitment of STAT-1alpha and IRF-1 to the endogenous CIITA promoter IV (pIV). The recruitment of USF-1 to CIITA pIV is also reduced by statins, as is the recruitment of RNA polymerase II (Pol II), p300 and Brg-1. These data indicate that statins inhibit the transcriptional program of the CIITA gene.


Figures

Figure 1
Figure 1. Simvastatin and Lovastatin Inhibit IFN-γ-induced Class II MHC Expression by Suppressing CIITA mRNA Expression
(A) BMDM were pretreated with either SS (10 μM) or LVS (10 μ) for 24 h, and then stimulated by IFN-γ (5 ng/ml) for 15 h. Surface expression of class II MHC protein was assessed by flow cytometry. IFN-γ induction of class II MHC protein was set at 100%, and statin treatment compared to that. Mean ± S.D. of four experiments. *, p ≤ 0.05, compared with IFN-≤ treatment. (B) A representative flow cytometry result with SS (10 μM) treatment. (C) BMDM were pretreated with SS (10 μM) for 24 h prior to IFN-γ treatment for 15 h or (D) primary murine microglia were pretreated with SS (10 μM) for 12 h prior to IFN-γ treatment for 15 h. Total RNA was analyzed by RTPCR with primers specific for class II MHC, CIITA and GAPDH. Values were normalized to GAPDH mRNA. The basal level of the untreated sample was set as 1.0, and fold induction was compared with that. Representative of three independent experiments.
Figure 2
Figure 2. Simvastatin and Lovastatin Inhibit IFN-γ-induced Class II MHC and CIITA Expression in RAW264.7 Cells
Cells were treated with different concentrations of SS (0-10 μM) or LVS (10 μM) for 12 h and then stimulated by IFN-γ (10 ng/ml) for 15 h. (A) Surface expression of class II MHC was assessed by flow cytometry. IFN-γ induction of class II MHC protein was set at 100%, and statin treatment compared to that. Mean ± S.D. of three experiments. *, p ≤ 0.05, **, p ≤ 0.001, compared with IFN-γ treatment. (B) Total RNA was analyzed by RT-PCR with primers specific for class II MHC, CIITA and GAPDH. Values were normalized to GAPDH mRNA. The basal level of the untreated sample was set as 1.0, and fold induction was compared with that. Representative of three independent experiments. (C) Cells were pretreated with either medium alone or SS (1 μM) for 12 h, and then stimulated by IFN-γ (10 ng/ml) for 15 h. Actinomycin D (Act-D) (5 μg/ml) was added at this point (time 0), and cells were harvested at the indicated times (0.5-4 h). Total RNA was analyzed by RPA for CIITA and GAPDH mRNA expression. CIITA mRNA was normalized to GAPDH mRNA in each sample, and the value for CIITA mRNA at time 0 (before the addition of Act-D) was set to 100. Mean ± S.D. of four experiments.
Figure 3
Figure 3. The Inhibitory Effect of Simvastatin is Dependent on the HMG-CoA Reductase Pathway
RAW264.7 cells were pretreated with SS (10 μM), SS plus metaboli cintermediates (500 μM MVLT, 5 μM GGPP, 5 μM FPP, or 500 μM Cholesterol) (A), FTI-277 (5-20 μM) or GGTI-298 (5-20 μM) (B) or Toxin A (1-2.5 nM) (D) for 12 h, and then were stimulated by IFN-γ (10 ng/ml) for 12 h. (A, B, D) Total RNA was analyzed by RT-PCR with primers specific for CIITA and GAPDH. Values were normalized to GAPDH mRNA. The basal level of the untreated sample was set as 1.0, and fold induction was compared with that. Representative of three independent experiments. (C) Cells were transiently transfected with the CIITA pIV construct. Cells were pretreated with FTI-277 (20 μM) or GGTI-298 (20 μM)for 12 h, and then stimulated by IFN-γ (10 ng/ml) for 12 h. Luciferase activity was determined from the cell lysates, as described in Materials and Methods. The results are shown as fold induction (mean ± S.D.) of three independent experiments in which all samples were assayed in duplicate, *, p ≤ 0.05, compared with IFN-γ treatment.
Figure 4
Figure 4. IFN-γ-induced Rac1 Activation is Involved in CIITA Expression
(A) RAW264.7 cells were transiently co-transfected with the CIITA pIV construct and increasing amounts of pRK5-Rac1N17 (dnRac1) (0, 0.1, 0.25, 0.5, 1 μg) or pcDNA3 for 24 h, and then treated with IFN-γ (10 ng/ml) for 12 h. Luciferase activity was determined as described in Materials and Methods. The results are shown as fold induction (mean ± S.D.) of three independent experiments in which all samples were assayed in duplicate. *, p ≤ 0.05, **, p ≤ 0.001, compared with IFN-γ treatment. (B) RAW264.7 cells were pretreated with the Rac1 inhibitor (100 μM) for 24 h, and then stimulated with IFN-γ for 12 h. Total RNA was analyzed by RT-PCR with primers specific for CIITA and GAPDH. Values were normalized to GAPDH mRNA. The basal level of the untreated sample was set as 1.0, and fold induction was compared with that. Representative of three independent experiments. Cells were treated with IFN-γ (10 ng/ml) for the indicated times (C) or pretreated with SS (10 μM) for 12 h and then stimulated with IFN-γ for 15 min (D). The amount of Rac1 bound to the GST-PBD fusion protein was analyzed by immunoblotting as described in Materials and Methods. Representative of three experiments. (E) RAW264.7 cells were pretreated with the Rac1 inhibitor (100 μM) for 24 h, and then incubated in the absence or presence of IFN-γ for 30 min. Total cell lysates were analyzed by immunoblotting with phospho-STAT-α, stripped, and reprobed with total STAT-α and actin antibodies. Representative of three experiments.
Figure 5
Figure 5. Simvastatin Inhibits STAT-Aα and IRF-1 Expression in BMDM
(A) Primary murine microglia isolated from wild type or STAT-A-deficient 129 mice were incubated with medium or IFN-γ (10 ng/ml) for 12 h. Total RNA was analyzed by RT-PCR with primers specific for class II MHC, CIITA and GAPDH. Representative of three experiments. (B) BMDM were pretreated with SS (1-10 μM) for 24 h, and then stimulated by IFN-γ for 30 min. Total cell lysates were analyzed by immunoblotting with phospho-STAT-Aα, stripped, and reprobed with total STAT-Aα and actin antibodies. Representative of three experiments. (C) BMDM were treated with SS (10 αM) for 0-36 h. Total RNA was analyzed by RT-PCR with primers specific for STAT-A and GAPDH. Values were normalized to the respective GAPDH levels. The basal level of the untreated sample was set as 1.0, and fold induction was compared with that. Representative of four independent experiments. (D) BMDM were pretreated with SS (10 αM) for 24 h, and then stimulated by IFN-γ for 3 h. Total cell lysates were analyzed by immunoblotting with IRF-1, stripped, and reprobed with actin antibodies. Representative of three experiments.
Figure 6
Figure 6. Simvastatin Does Not Suppress USF-1 Expression
RAW264.7 cells were incubated with increasing concentrations of SS (0-10 μM) for 16 h (A, B). Nuclear extracts were prepared, and analyzed by immunoblotting with USF-1, HDAC1, or Sp1 antibodies (A), while total RNA was analyzed by RT-PCR with primers specific for USF-1 and GAPDH (B). Representative of three independent experiments.
Figure 7
Figure 7. Simvastatin Affects the Transcriptional Program of the Endogenous CIITA pIV Promoter
RAW264.7 cells were either stimulated with IFN-γ for up to 6 h (A) or pretreated with SS (10 μM) for 12 h, and then stimulated with IFN-γ for 2 h (B-E). Cells were cross-linked with formaldehyde, and the soluble chromatin was subjected to immunoprecipitation with antibodies against STAT-Aα, IRF-1, USF-1, AcH3, AcH4, RNA Pol II, p300, Brg-1, rabbit IgG or mouse IgG, followed by PCR for either the CIITA pIV (AD) or the EFP promoter (E). Input chromatin was subjected to PCR to control for variations in immunoprecipitation starting material. Polyclonal rabbit IgG or monoclonal mouse IgG was used as a negative immunoprecipitation control for nonspecific binding. The basal level of the untreated sample was set as 1.0, and fold induction was compared with that. Representative of three independent experiments.
Figure 8
Figure 8. Proposed Model of Statin-mediated Inhibition of CIITA IV Gene Expression
(A) CIITA IV promoter elements include GAS, E-box and IRE. IFN-γ-induced CIITA gene expression involves recruitment of STAT-Aα, IRF-1 and USF-1 to the CIITA pIV, as well as acetylation of histones H3 and H4 (shown as purple circles). In addition, co-activators such as p300 and Brg-1 and RNA Pol II are recruited to the CIITA pIV, initiating CIITA gene transcription. (B) SS or the Rac1 inhibitor suppress constitutive STAT-Aα expression. This results in inhibition of STAT-Aα activation, subsequently leading to a reduction of IFN-γ-induced IRF-1 gene expression. This inhibition is associated with reduced recruitment of STAT-Aα and IRF-1 to the CIITA pIV. In addition, recruitment of USF-1 is decreased, whereas its expression is not affected. The recruitment of p300, Brg-1 and RNA Pol II is decreased by SS treatment, thereby inhibiting CIITA gene transcription. Green circles indicate phosphorylation.

Similar articles

Cited by

References

    1. Turesson C. Endothelial expression of MHC class II molecules in autoimmune disease. Curr. Pharm. Des. 2004;10:129–143. - PubMed
    1. O'Keefe GM, Nguyen VT, Benveniste EN. Regulation and function of class II major histocompatibility complex, CD40, and B7 expression in macrophages and microglia: Implications in neurological diseases. J. Neurovirol. 2002;8:496–512. - PubMed
    1. Tian C, Bagley J, Cretin N, Seth N, Wucherpfennig KW, Iacomini J. Prevention of type 1 diabetes by gene therapy. J. Clin. Invest. 2004;114:969–978. - PMC - PubMed
    1. Feldmann M, Brennan FM, Maini RN. Rheumatoid arthritis. Cell. 1996;85:307–310. - PubMed
    1. Dyment DA, Sadovnick AD, Ebers GC. Genetics of multiple sclerosis. Hum. Mol. Genet. 1997;6:1693–1698. - PubMed

Publication types

MeSH terms

Substances