. 2008 Jul 4:2:57.
doi: 10.1186/1752-0509-2-57.

Seeded Bayesian Networks: constructing genetic networks from microarray data

Affiliations

Seeded Bayesian Networks: constructing genetic networks from microarray data

Amira Djebbari et al. BMC Syst Biol. .

Abstract

Background: DNA microarrays and other genomics-inspired technologies provide large datasets that often include hidden patterns of correlation between genes reflecting the complex processes that underlie cellular metabolism and physiology. The challenge in analyzing large-scale expression data has been to extract biologically meaningful inferences regarding these processes - often represented as networks - in an environment where the datasets are often imperfect and biological noise can obscure the actual signal. Although many techniques have been developed in an attempt to address these issues, to date their ability to extract meaningful and predictive network relationships has been limited. Here we describe a method that draws on prior information about gene-gene interactions to infer biologically relevant pathways from microarray data. Our approach consists of using preliminary networks derived from the literature and/or protein-protein interaction data as seeds for a Bayesian network analysis of microarray results.

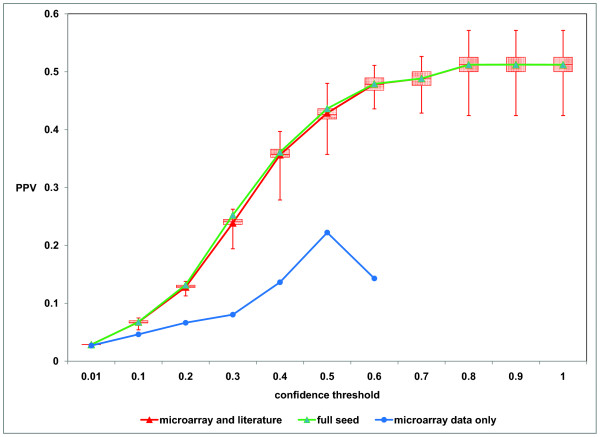
Results: Through a bootstrap analysis of gene expression data derived from a number of leukemia studies, we demonstrate that seeded Bayesian Networks have the ability to identify high-confidence gene-gene interactions which can then be validated by comparison to other sources of pathway data.

Conclusion: The use of network seeds greatly improves the ability of Bayesian Network analysis to learn gene interaction networks from gene expression data. We demonstrate that the use of seeds derived from the biomedical literature or high-throughput protein-protein interaction data, or the combination, provides improvement over a standard Bayesian Network analysis, allowing networks involving dynamic processes to be deduced from the static snapshots of biological systems that represent the most common source of microarray data. Software implementing these methods has been included in the widely used TM4 microarray analysis package.


Figures

Figure 1
Figure 1
A Bayesian network example where each random variable corresponds to a gene that can take one of three states corresponding to its transcriptional response: -1 for under-expressed, 0 for unchanged, and +1 for over-expressed. The table represents a subset of the complete set of conditional probabilities for Gene2, here indicating the likelihood that Gene2 is up-regulated given the transcriptional state of Gene1.
Figure 2
Figure 2
Networks arising from a Bayesian Network analysis of gene expression data of Golub et al. [17] and rendered in Cytoscape [29] using (A) no prior information and (B) prior network seeds deduced from a combination of the literature and the protein-protein interaction data of Rual et al. [16]. In both cases, the BNs were learned using a greedy hill climbing algorithm to optimize the BDe score. Shown here are edges representing the Markov relation between genes with confidence scores of at least 0.70 after 100 bootstrap iterations. In (A), genes highlighted in blue are involved in regulation of transcription; no other clear functional class is represented. This network is comprised of 24 nodes, 41 edges; relative to the network one could postulate based on the literature and PPI data it is missing 42 edges and contains 41 "extra" edges. For (B), genes highlighted in blue are involved in regulation of transcription, those in green are involved in cell cycle, and genes in red are involved in ubiquitination. Compared with the literature and PPI network used as a prior, this network, containing 41 nodes and 68 edges, has 0 missing edges, and 25 extra edges.
Figure 3
Figure 3
Sensitivity, specificity tradeoff (A) and PPV (B) vs. confidence threshold when using microarray data alone or seeds derived from literature. The Bayesian networks were learned from 100 bootstrap iterations using the hill climbing algorithm and BDe score using the leukemia datasets ofRoss et al. [18,19]. The learned networks were compared to corresponding subgraphs of KEGG cell cycle pathway (KEGG ID: hsa04110).
Figure 4
Figure 4
ROC curve for Markov relations for networks deduced from the Ross et al.[18,19]data either with or without network seeds (literature plus PPI), based on 100 bootstrap iterations. The learned networks were compared to corresponding subgraphs of KEGG cell cycle pathway (KEGG ID: hsa04110) and indicate much better overall performance for networks derived using network seeds.
Figure 5
Figure 5
For the Ross et al.[18,19]data, we began with our original literature network seed and systematically deleted each individual gene, learning Bayesian networks through 100 bootstrap iterations both with and without these altered literature priors. Shown here is the positive predictive value (PPV) for identifying directed edges as a function of bootstrap confidence.

References

    1. Weaver DC, Workman CT, Stormo GD. Modeling regulatory networks with weight matrices. Pac Symp Biocomput. 1999:112–123. - PubMed
    1. Akutsu T, Miyano S, Kuhara S. Identification of genetic networks from a small number of gene expression patterns under the Boolean network model. Pac Symp Biocomput. 1999:17–28. - PubMed
    1. Chen T, He HL, Church GM. Modeling gene expression with differential equations. Pac Symp Biocomput. 1999:29–40. - PubMed
    1. Friedman N, Linial M, Nachman I, Pe'er D. Using Bayesian networks to analyze expression data. J Comput Biol. 2000;7:601–620. - PubMed
    1. Spellman PT, Sherlock G, Zhang MQ, Iyer VR, Anders K, Eisen MB, Brown PO, Botstein D, Futcher B. Comprehensive identification of cell cycle-regulated genes of the yeast Saccharomyces cerevisiae by microarray hybridization. Mol Biol Cell. 1998;9:3273–3297. - PMC - PubMed

Publication types

LinkOut - more resources