Comparative Study
. 2008 Oct;213(2):268-80.
doi: 10.1016/j.expneurol.2008.05.023. Epub 2008 Jun 9.

Altered neuronal activity relationships between the pedunculopontine nucleus and motor cortex in a rodent model of Parkinson's disease

Affiliations
Comparative Study

Altered neuronal activity relationships between the pedunculopontine nucleus and motor cortex in a rodent model of Parkinson's disease

Bhooma R Aravamuthan et al. Exp Neurol. 2008 Oct.

Abstract

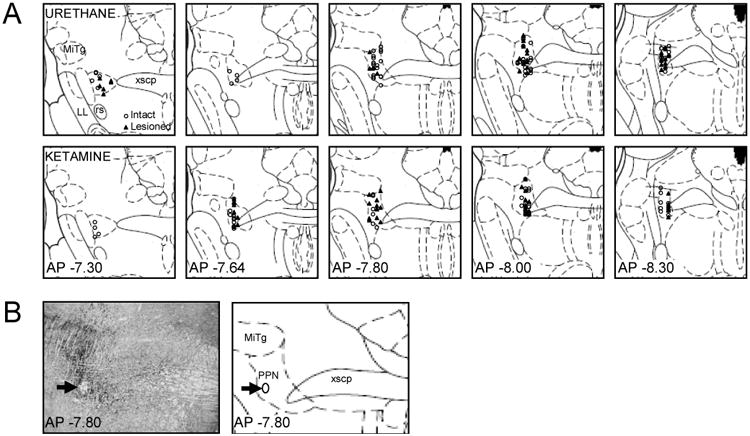
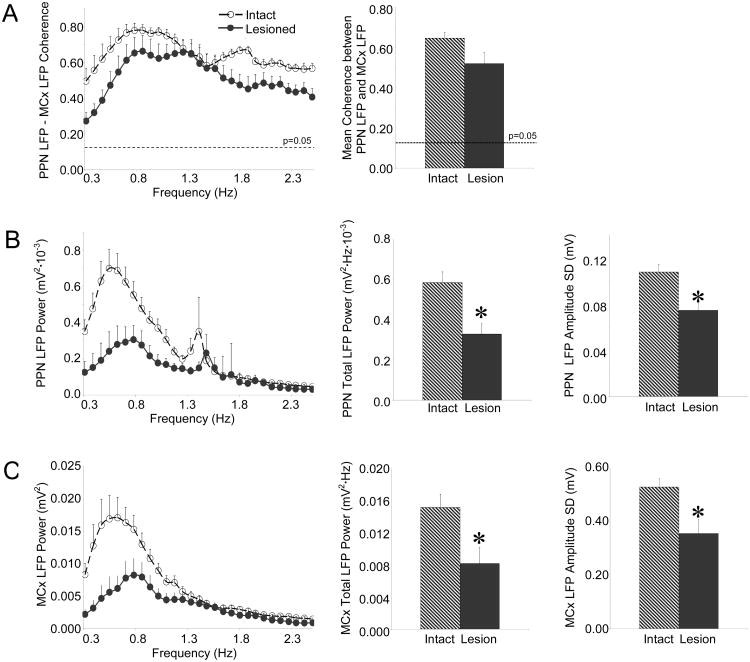
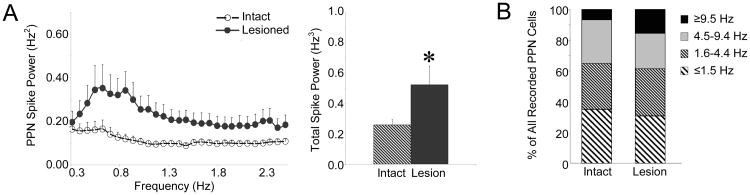
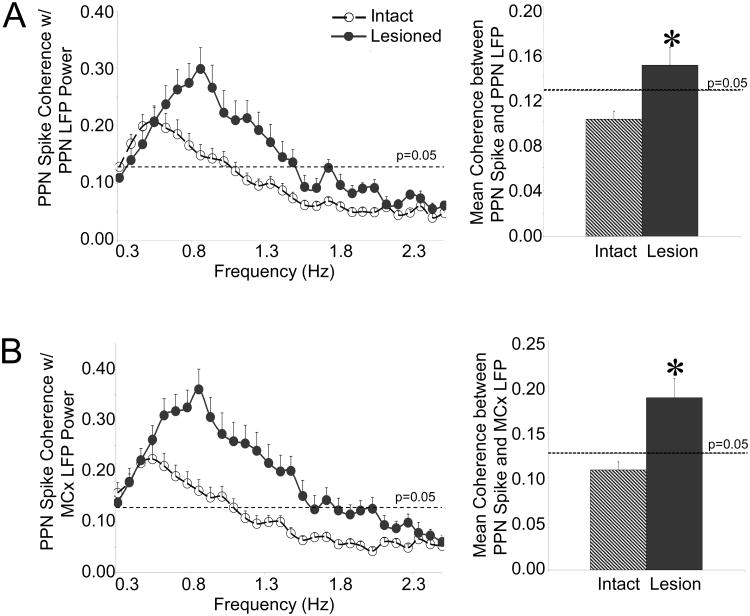
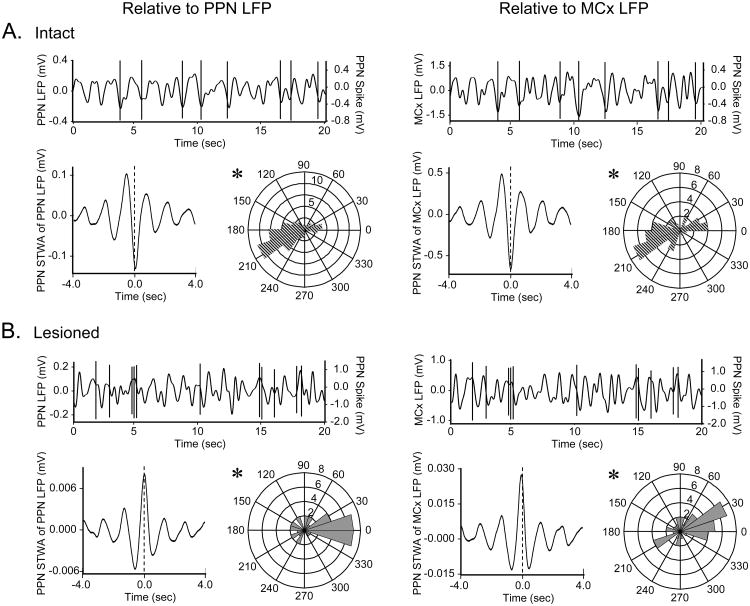
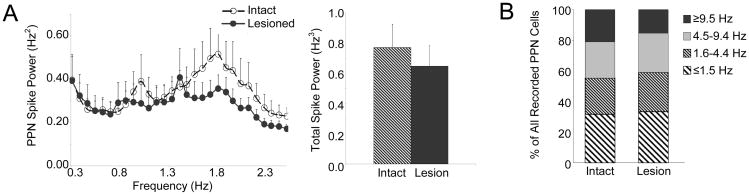
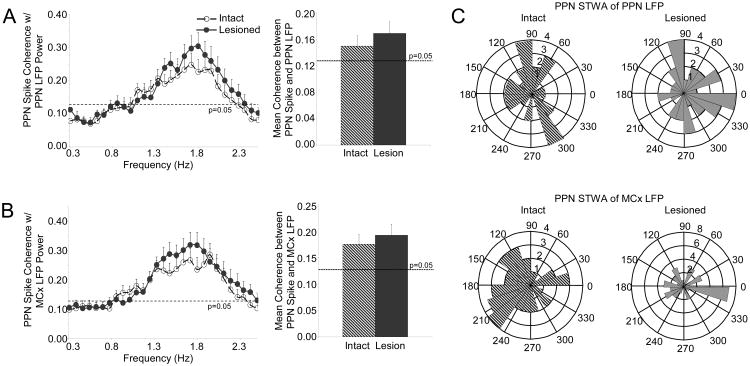
The pedunculopontine nucleus (PPN) is a new deep brain stimulation (DBS) target for Parkinson's disease (PD), but little is known about PPN firing pattern alterations in PD. The anesthetized rat is a useful model for investigating the effects of dopamine loss on the transmission of oscillatory cortical activity through basal ganglia structures. After dopamine loss, synchronous oscillatory activity emerges in the subthalamic nucleus and substantia nigra pars reticulata in phase with cortical slow oscillations. To investigate the impact of dopamine cell lesion-induced changes in basal ganglia output on activity in the PPN, this study examines PPN spike timing with reference to motor cortex (MCx) local field potential (LFP) activity in urethane- or ketamine-anesthetized rats. Seven to ten days after unilateral 6-hydroxydopamine lesion of the medial forebrain bundle, spectral power in PPN spike trains and coherence between PPN spiking and PPN LFP activity increased in the approximately 1 Hz range in urethane-anesthetized rats. PPN spike timing also changed from firing predominantly in phase with MCx slow oscillations in the intact urethane-anesthetized rat to firing predominantly antiphase to MCx oscillations in the hemi-parkinsonian rat. These changes were not observed in the ketamine-anesthetized preparation. These observations suggest that dopamine loss alters PPN spike timing by increasing inhibitory oscillatory input to the PPN from basal ganglia output nuclei, a phenomenon that may be relevant to motor dysfunction and PPN DBS efficacy in PD patients.


Figures

Figure 1
Figure 1
Location of Recorded PPN Cells in Intact and 6-OHDA Lesioned Urethane and Ketamine-Anesthetized Rats. Recordings in intact rats are shown as open circles and recordings in lesioned rats are shown as closed triangles (A). An example of histological confirmation of recording location in the PPN is shown on a 20 μm coronal brain section stained for acetylcholinesterase (B). Arrows indicate the site of a dye deposit on an image (left) and schematic (right) of the stained section. The dye deposit itself is washed off during acetylcholinesterase staining to leave a hole in the slice that is visible on the image (left) and indicated as an ellipse on the schematic (right). Distance from bregma is indicated for each coronal slice in mm. Abbreviations: PPN: pedunculopontine nucleus, PAG: periaqueductal gray, xscp: decussation of the superior cerebellar peduncle, MiTg: microcellular tegmental nucleus, LL: lateral lemniscus, rs: rubrospinal tract. Schematics of coronal slices are adapted from The Rat Brain in Stereotaxic Coordinates, 2nd Ed. (Paxinos and Watson, 1986).
Figure 2
Figure 2
Characteristics of PPN LFP and MCx LFP activity in the urethane-anesthetized preparation. Coherence between PPN and MCx LFP activity (A, n=10 intact rats, 11 lesioned rats) does not change significantly in the ∼1 Hz range (left) following dopamine cell lesion nor does mean coherence in the 0.3-2.5 Hz range (right). Dashed horizontal lines indicate the P=0.05 level of significance for coherence. LFP activity recorded in the PPN (B, n=15 intact rats, 11 lesioned rats) and MCx (C, n=11 intact rats, 11 lesioned rats) is described by comparing LFP power spectra in the 0.3-2.5 Hz range (left), total LFP power in the 0.3-2.5 Hz range (middle), and the RMS of LFP amplitude (right) between intact and lesioned rats. Both PPN and MCx LFP activity exhibit decreases in power in the ∼1 Hz range (left), decreases in total power between 0.3-2.5 Hz (middle), and decreases in LFP amplitude (right) following dopamine cell lesion. *P<0.05 compared with intact.
Figure 3
Figure 3
Characteristics of PPN spike trains in the urethane-anesthetized preparation. Oscillatory activity in PPN spike trains (A, n=59 PPN cells in 17 intact rats, 38 cells in 11 lesioned rats) was determined by converting PPN spike trains to Gaussian waveforms with a 20 Hz sampling rate and then using FFT to determine power in the 0.3-2.5 Hz range. There is an increase in power in the ∼1 Hz range in PPN spike trains following dopamine cell lesion (left) with a significant increase in total power between 0.3-2.5 Hz following dopamine cell lesion (right). * P<0.05 compared with intact. Firing rate distributions (B, n=59 cells in 17 intact rats, 38 cells in 11 lesioned rats) are indicated for the intact and 6-OHDA lesioned animals. There was no significant difference in firing rate between intact and lesioned rats.
Figure 4
Figure 4
Relationships between oscillatory activity in PPN spiking and LFP activity in the urethane-anesthetized preparation. Coherence between PPN spike trains and PPN LFP (A, n=59 cells in 17 intact rats, 38 cells in 11 lesioned rats) and coherence between PPN spike trains and MCx LFP (B, n=42 cells in 12 intact rats, 38 cells in 11 lesioned rats) LFP activity increase following dopamine cell lesion in the ∼1 Hz range (left). Mean coherence between PPN spiking and PPN LFP activity and mean coherence between PPN spiking and MCx LFP activity also increase across the 0.3-2.5 Hz range (right). * P<0.05 compared with intact.
Figure 5
Figure 5
PPN spike timing relative to LFP oscillatory activity in the urethane-anesthetized preparation. Typical PPN spike trains in intact (A) and lesioned (B, n=37 significantly oscillatory cells in lesioned rats) rats are shown at the top of each panel overlaid on simultaneously recorded PPN LFP (left, n=54 cells with significant peaks in their STWAs in 16 intact rats, 37 cells in 11 lesioned rats) or MCx LFP (right, n=37 cells in 12 intact rats, 39 cells in 11 lesioned rats) activity. PPN spike-triggered LFP waveform averages (lower left of each panel) illustrate the time of PPN spiking relative to the phase of LFP oscillatory activity in the example spike train. Polar histogram plots (lower right of each panel) summarize the distribution of phases of PPN spikes with respect to PPN LFP (left) and MCx LFP (right) oscillations. In the intact rat, spiking occurs at or near the trough (∼180°) of PPN and MCx LFP activity. Dopamine cell lesion significantly changes this phase relationship as PPN spiking occurs primarily at the peaks (∼0°) of LFP oscillations in lesioned rats. *Significantly (P<0.05) unimodal distributions of phase relationships between PPN spiking and LFP activity.
Figure 6
Figure 6
Characteristics of PPN LFP and MCx LFP activity in the ketamine-anesthetized preparation. Coherence between PPN LFP and MCx LFP activity (A, n=9 intact rats, 10 lesioned rats) also does not change significantly in the 0.8-2.5 Hz range (left) following dopamine cell lesion nor does mean coherence in the 0.3-2.5 Hz range (right). LFP activity recorded in the PPN (B n=9 intact rats, 10 lesioned rats) and MCx (C n=9 intact rats, 12 lesioned rats) is described by comparing LFP power spectra in the 0.3-2.5 Hz range (left), total LFP power in the 0.3-2.5 Hz range (middle), and the RMS of LFP amplitude (right) between intact and lesioned rats. Dopamine cell lesion does not change PPN LFP or MCx LFP power or amplitude in the 0.3-2.5 range.
Figure 7
Figure 7
Characteristics of PPN spike trains in the ketamine-anesthetized preparation. Oscillatory activity in PPN spike trains (A, n=37 cells in 9 intact rats, 38 cells in 12 lesioned rats) was not significantly different between intact and lesioned rats in the ∼1 Hz range (left). Dopamine cell lesion had no significant effect on total power in PPN spike trains between 0.3-2.5 Hz (right). Firing rate distributions (B, n=37 cells in 9 intact rats, 38 cells in 12 lesioned rats) are indicated for the intact and dopamine cell lesioned animals. There was also no significant difference in firing rate between the intact and lesioned rat.
Figure 8
Figure 8
Relationships between PPN spiking and LFP activity in the ketamine-anesthetized preparation. Coherence between PPN spike trains and PPN LFP (A, n=37 cells in 9 intact rats, 38 cells in 12 lesioned rats) and coherence between PPN spike trains and MCx LFP (B, n=37 cells in 9 intact rats, 38 cells in 12 lesioned rats) do not change following dopamine cell lesion. There is also no change in mean coherence between PPN spiking and PPN LFP or MCx LFP activity in the 0.3-2.5 Hz range (right). Polar histogram plots (C) summarize the distribution of phases of PPN spikes with respect to PPN LFP (top, n=38 significantly oscillatory cells in 9 intact rats, 32 cells in 12 lesioned rats) and MCx LFP (bottom, n=36 cells in 9 intact rats, 35 cells in 12 lesioned rats) oscillations. There is no consistent phase-locking between PPN spiking and LFP activity in the intact (left) or lesioned (right) rats.

Comment in

References

    1. Allers KA, Bergstrom DA, Ghazi LJ, Kreiss DS, Walters JR. MK801 and amantadine exert different effects on subthalamic neuronal activity in a rodent model of Parkinson's disease. Exp Neurol. 2005;191:104–118. - PubMed
    1. Amzica F, Steriade M. Cellular substrates and laminar profile of sleep K-complex. Neuroscience. 1998;82:671–686. - PubMed
    1. Androulidakis AG, Khan S, Litvak V, Pleydell-Pearce CW, Brown P, Gill SS. Local field potential recordings from the pedunculopontine nucleus in a Parkinsonian patient. NeuroReport. 2008;19:59–62. - PubMed
    1. Anis NA, Berry SC, Burton NR, Lodge D. The dissociative anaesthetics, ketamine and phencyclidine, selectively reduce excitation of central mammalian neurones by N-methyl-aspartate. Br J Pharmacol. 1983;79:565–575. - PMC - PubMed
    1. Aravamuthan BR, Muthusamy KA, Stein JF, Aziz TZ, Johansen-Berg H. Topography of cortical and subcortical connections of the human pedunculopontine and subthalamic nuclei. NeuroImage. 2007;37:694–705. - PubMed

Publication types