. 2008 Sep;31(3):433-41.
doi: 10.1016/j.nbd.2008.05.020. Epub 2008 Jun 14.

HIF-1alpha inhibition ameliorates neonatal brain injury in a rat pup hypoxic-ischemic model

Affiliations

HIF-1alpha inhibition ameliorates neonatal brain injury in a rat pup hypoxic-ischemic model

Wanqiu Chen et al. Neurobiol Dis. 2008 Sep.

Abstract

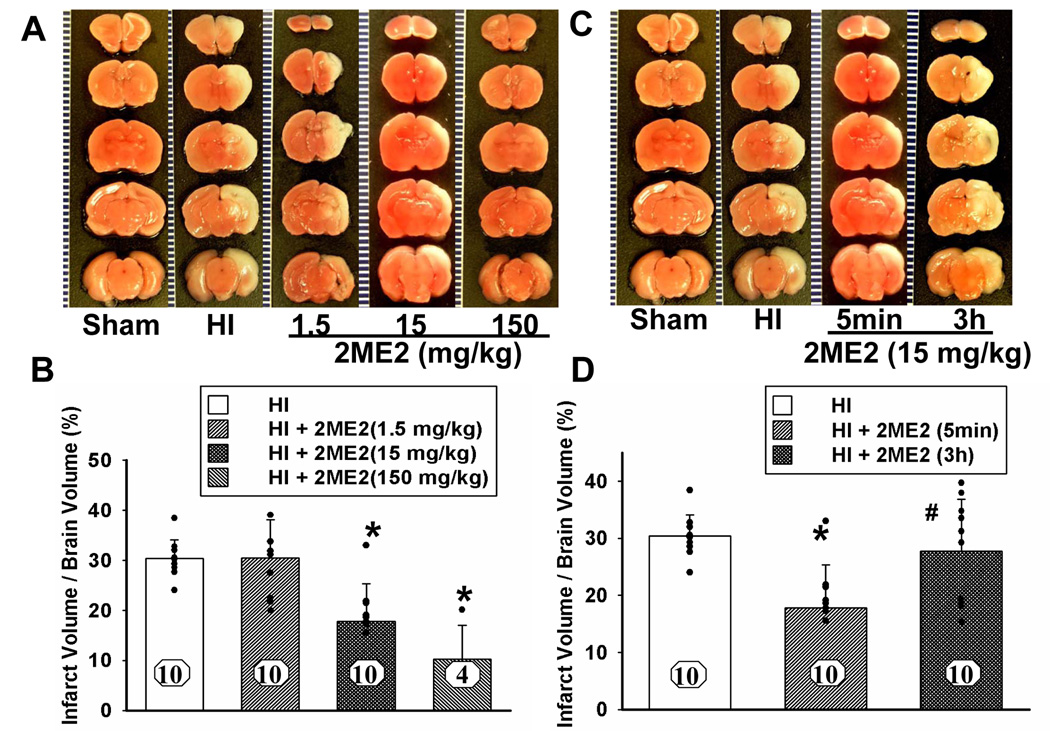
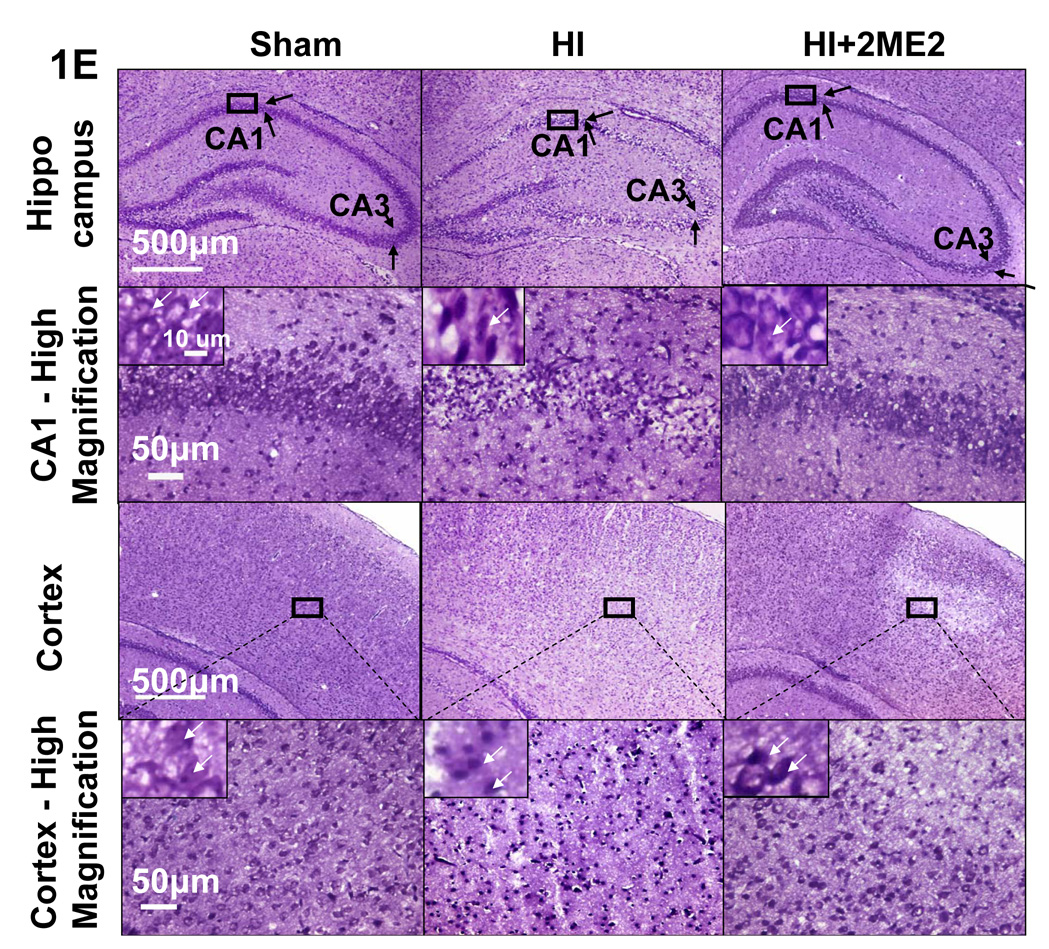
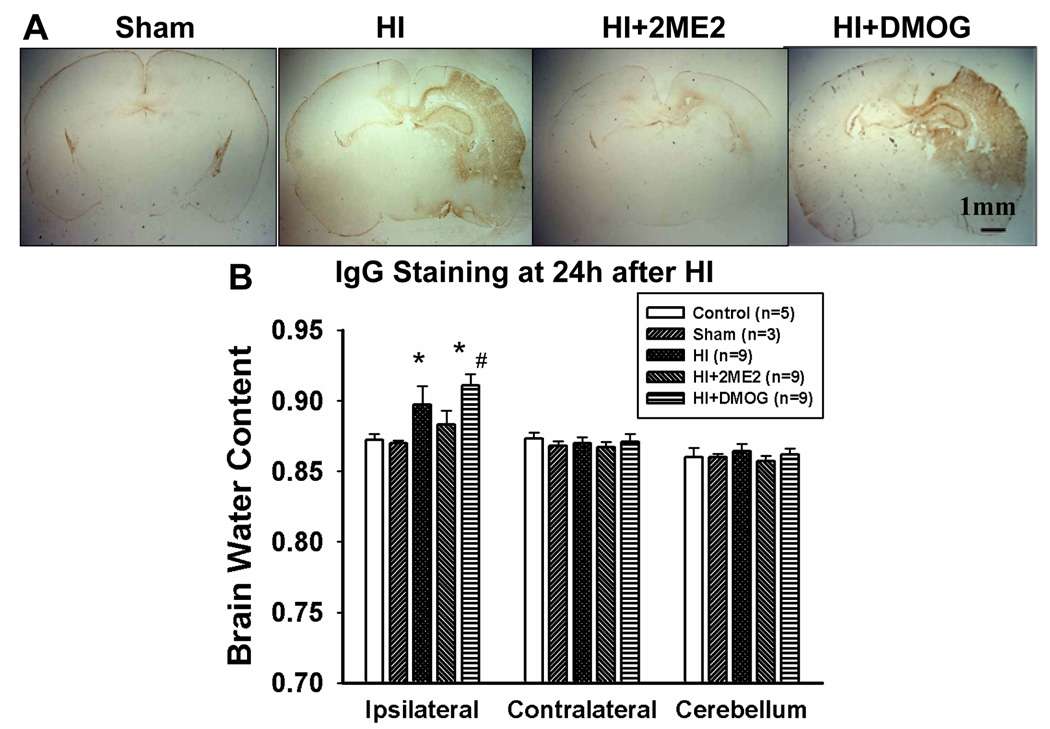
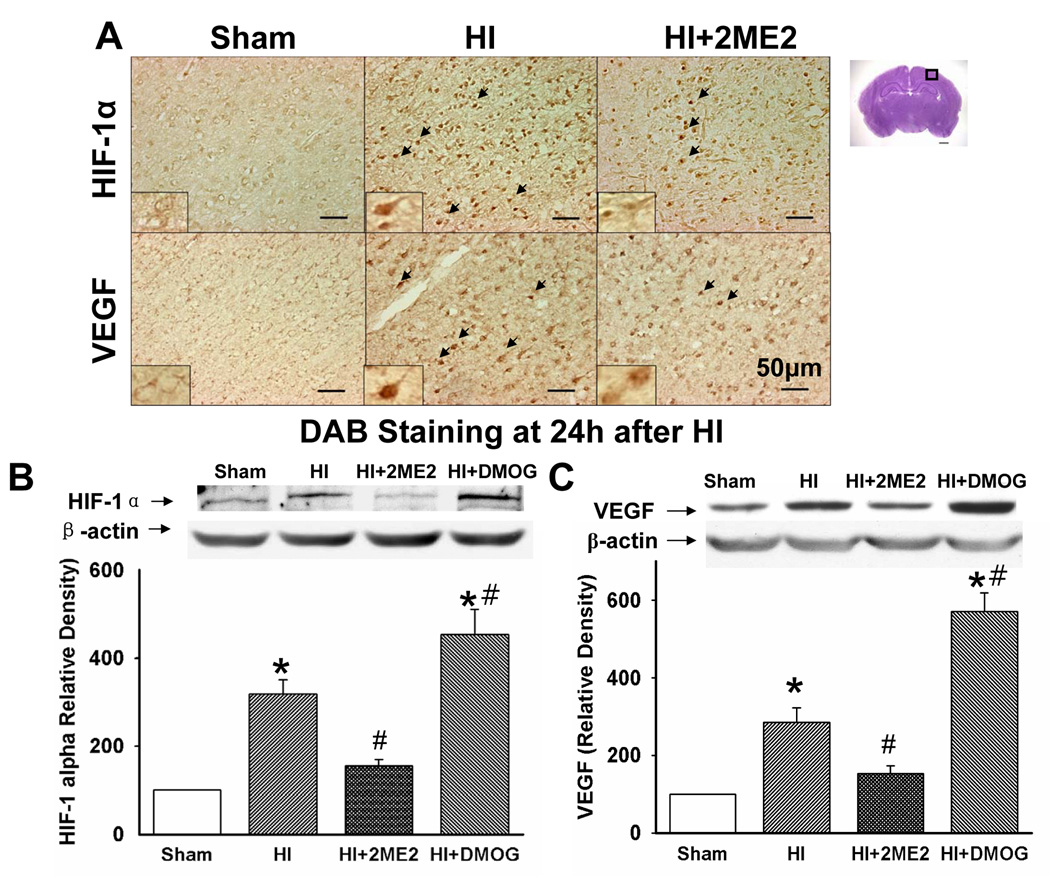
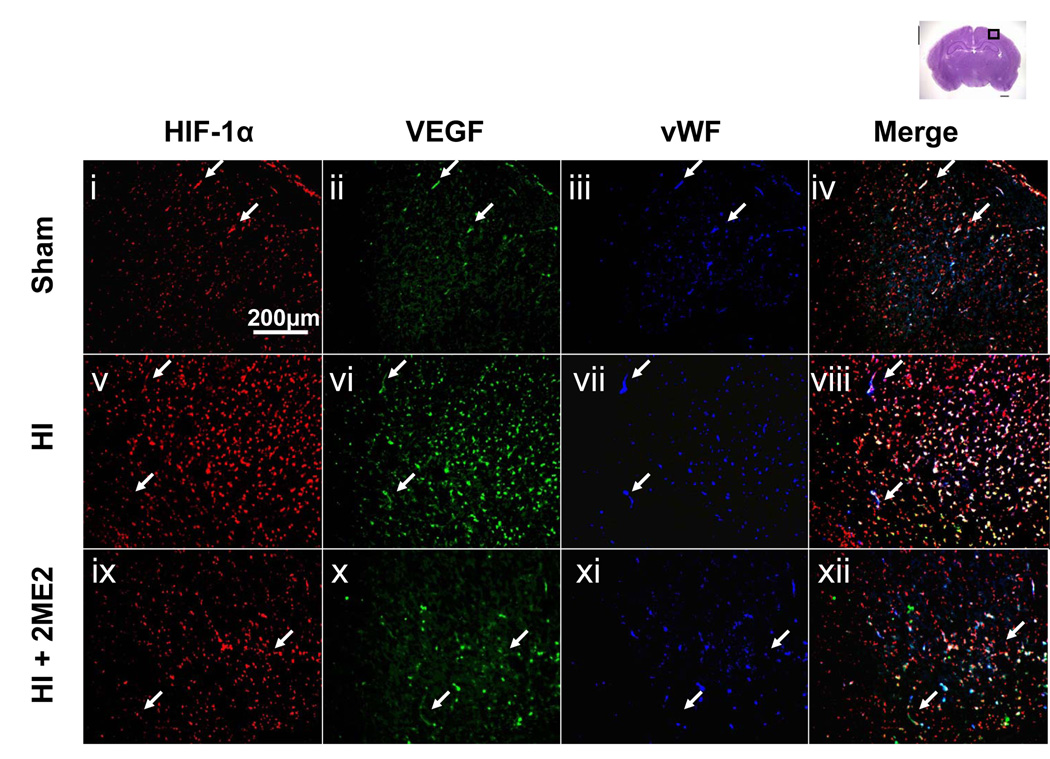
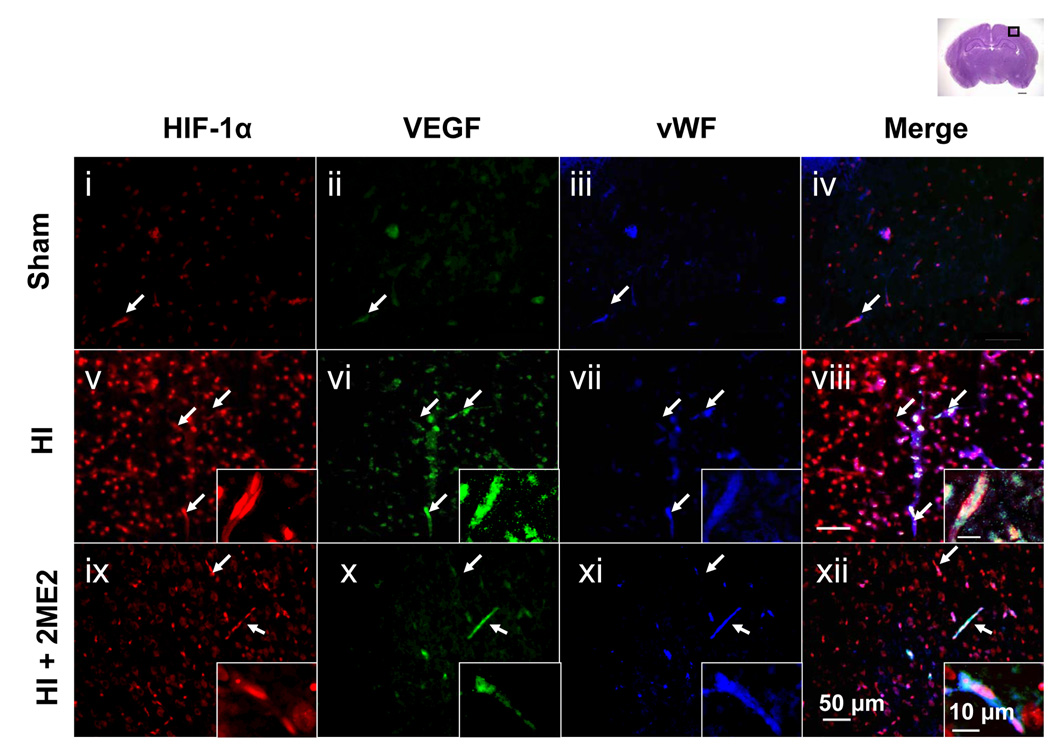
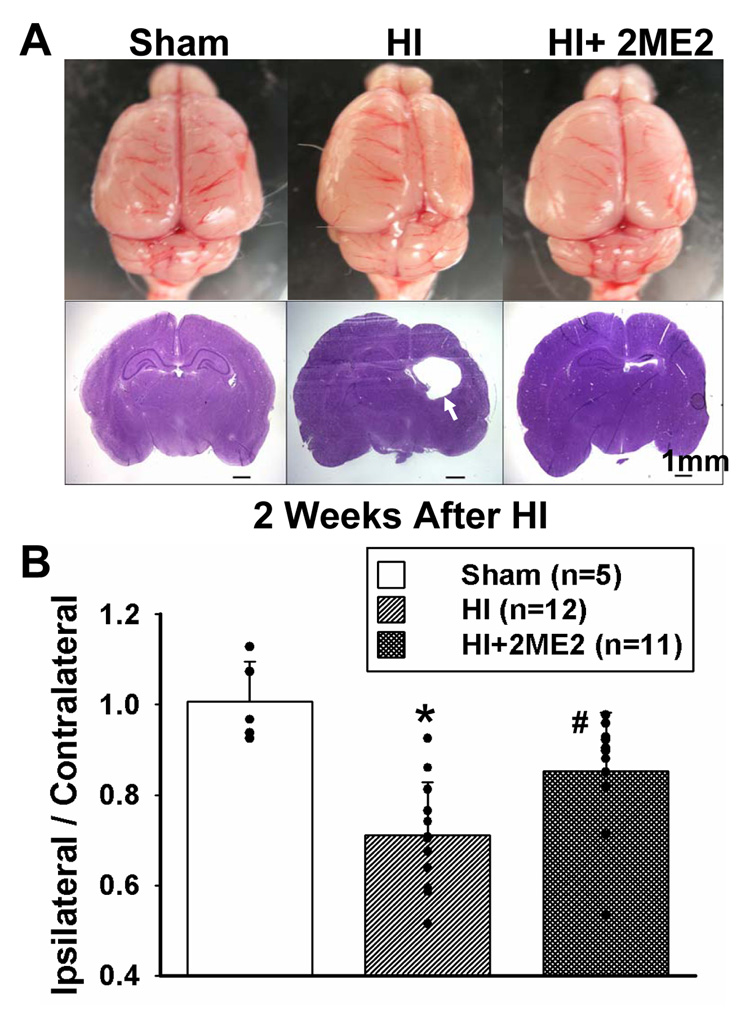
Hypoxia-inducible factor-1alpha (HIF-1alpha) has been considered as a regulator of both prosurvival and prodeath pathways in the nervous system. The present study was designed to elucidate the role of HIF-1alpha in neonatal hypoxic-ischemic (HI) brain injury. Rice-Vannucci model of neonatal hypoxic-ischemic brain injury was used in seven-day-old rats, by subjecting unilateral carotid artery ligation followed by 2 h of hypoxia (8% O2 at 37 degrees C). HIF-1alpha activity was inhibited by 2-methoxyestradiol (2ME2) and enhanced by dimethyloxalylglycine (DMOG). Results showed that 2ME2 exhibited dose-dependent neuroprotection by decreasing infarct volume and reducing brain edema at 48 h post HI. The neuroprotection was lost when 2ME2 was administered 3 h post HI. HIF-1alpha upregulation by DMOG increased the permeability of the BBB and brain edema compared with HI group. 2ME2 attenuated the increase in HIF-1alpha and VEGF 24 h after HI. 2ME2 also had a long-term effect of protecting against the loss of brain tissue. The study showed that the early inhibition of HIF-1alpha acutely after injury provided neuroprotection after neonatal hypoxia-ischemia which was associated with preservation of BBB integrity, attenuation of brain edema, and neuronal death.


Figures

Figure 1
Figure 1. Dose Dependent Effect and Time Window of 2ME2
Figure 1E. Nissl Staining at 48h after HI Effects of 2ME2 on the reduction of infarct volume and neuronal death. (A) Representative TTC stained coronal brain sections from sham, HI and treatment groups with different dosages of 2ME2 are shown. Number of animals, n = 10 for each group; however, 6 pups died in the 150 mg/kg treated group. The scale is shown on the left side of each TTC-stained brain with 1 mm being the shortest interval. (B) Quantitative analysis of infarct volume revealed that 2ME2 treatment produced a dose-dependent reduction in the infarct volume (*P<0.001, versus HI and 1.5 mg/kg treatment; vertical bars indicate SEM). (C) Representative TTC stained coronal brain sections from sham, HI and 2ME2 treated groups at different time points (5 min or 3 h after HI). Number of animals, n = 10 for each group. The scale is shown on the left side of each TTC-stained brain with 1 mm being the shortest interval. (D) Quantitative analysis of infarct volume revealed that 2ME2 treatment has a therapeutic time-window; treatment was effective when administered 5 min after injury whereas it was ineffective at 3 h after injury (* P < 0.001, versus HI; # P < 0.05, versus 2ME2-5min treatment; vertical bars indicate SEM). (E) Nissl staining of the cortex and hippocampus region in coronal sections of the brain from sham, HI and HI+2ME2 groups at 48 h after insult. CA1 and CA3 regions (shown by arrows in uppermost panels) showed thinning due to increased neuronal loss after HI. 2ME2 treatment ameliorated CA1 and CA3 damage. In the cortex regions, less staining density in HI group is due to more shrunken, pyknotic nuclei. These changes are attenuated in HI+2ME2 group. The region of interest (ROI) for the higher magnification is identified by boxes in low magnification images. The inset pictures in high magnification panels show highest magnification to show individual neurons. 2ME2 treatment prevented neuronal cell death in the ipsilateral cortex and hippocampus after hypoxic-ischemic injury. The scale shown in different panels represents 500 µm, 50 µm and 10 µm for low magnification, high magnification and highest magnification respectively.
Figure 2
Figure 2. BBB Leakage and Brain Edema
2ME2 preserved BBB disruption and attenuated brain edema after neonatal HI. (A) IgG staining in sections of the rat brain of sham, HI and HI+2ME2 groups, respectively. There is no staining in the sham section. A dense IgG staining (brown stain) was seen in the ipsilateral cortex and hippocampus in both the HI group and HI+DMOG group, which was reduced in 2ME2 treated group. (B) Quantification of brain water content in the cerebellum, ipsilateral and contralateral brain hemisphere 48 h after HI. Compared with the sham and naïve groups, the brain water content was markedly increased in the HI group (*P < 0.001 vs. naïve and sham. The naïve group contained normal pups without any surgery or treatment. Vertical bars indicate SEM). 2ME2-treatment significantly decreased ipsilateral hemisphere water content (*P < 0.001 vs. HI), whereas DMOG-treatment significantly increased its water content (# P < 0.05 vs. HI), as compared with the HI group. There was no statistical difference among the groups in contralateral hemisphere water content.
Figure 3
Figure 3. HIF-1α and VEGF Expression
Immunohistochemistry and Western blots for HIF-1α and VEGF expression after hypoxia-ischemia injury. (A) Immunostaining for HIF-1α and VEGF in the cortex of the ipsilateral hemisphere at 24 h after HI. Compared with the HI group, HIF-1α and VEGF expression was reduced in the 2ME2 group. Arrowheads indicate cells that are positive for HIF-1α and VEGF. (B and C) Representative Western blot analysis showed that HIF-1α and VEGF (with β-actin as a loading control) were expressed in the ipsilateral hemisphere at 24 h after HI respectively. Quantification of the Western blot analysis showed increased HIF-1α and VEGF in the HI group and DMOG-treatment group compared with both the sham group and the 2ME2-treatment group (*P < 0.001, versus sham; #P < 0.05, versus HI; vertical bars indicate SEM).
Figure 4
Figure 4. Co-localization of HIF-1α, VEGF in Endothelial Cells
HIF-1α and VEGF expression in endothelial cells and microvascular structures in the ipsilateral penumbra cortex 24 h after HI injury. Triple immunofluorescence staining images are presented at lower magnification (Figure 4A, i–xii) and higher magnification (Figure 4B, i–xii): HIF-1α (red) (i,v,ix), VEGF (green) (ii,vi,x), vWF (blue) (iii,vii,xi) and merged (iv,viii,xii). An increased expression of HIF-1α and VEGF were detected in the endothelial cells at 24 h after the HI injury (v–viii) as compared to sham (i–iv). 2ME2 treatment reduced the expression of HIF-1α and VEGF (ix–xii). Arrows show vascular structures. Insets in the right corner of v–xii are highest magnification showing endothelial structure and microvasculature. Scale bar represents 200 µm for low magnification (Figure 4A), 50 µm for high magnification (Figure 4B) and 10 µm for the insets (highest magnification).
Figure 5
Figure 5. Long Term Effects of 2ME2
Long term effects of 2ME2. (A) Top view of the brain from sham, HI and 2ME2-treated-group at 2 weeks after hypoxic-ischemic injury. The size of the ipsilateral hemisphere is smaller compared with the contralateral hemisphere in HI group, which suggested a significant tissue loss in the ipsilateral hemisphere. In the 2ME2-treated group, tissue loss in ipsilateral hemisphere was reduced. Nissl staining in coronal sections of the brain were obtained at the same time. Extensive cerebral and cortical atrophy and damage on the ipsilateral hemisphere were seen in the HI group which was attenuated in the 2ME2-treated group. Arrowhead indicates the atrophy. The quantification of the tissue loss (B) was expressed as the mass ratio of ipsilateral/contralateral hemisphere (*P < 0.001, versus sham; #P < 0.05, versus HI; vertical bars indicate SEM.)

References

    1. Aminova LR, Chavez JC, Lee J, Ryu H, Kung A, Lamanna JC, Ratan RR. Prosurvival and prodeath effects of hypoxia-inducible factor-1alpha stabilization in a murine hippocampal cell line. J Biol Chem. 2005;280:3996–4003. - PubMed
    1. Baranova O, Miranda LF, Pichiule P, Dragatsis I, Johnson RS, Chavez JC. Neuron-specific inactivation of the hypoxia inducible factor 1 alpha increases brain injury in a mouse model of transient focal cerebral ischemia. J Neurosci. 2007;27:6320–6332. - PMC - PubMed
    1. Bergeron M, Gidday JM, Yu AY, Semenza GL, Ferriero DM, Sharp FR. Role of hypoxia-inducible factor-1 in hypoxia-induced ischemic tolerance in neonatal rat brain. Ann Neurol. 2000;48:285–296. - PubMed
    1. Calvert JW, Cahill J, Yamaguchi-Okada M, Zhang JH. Oxygen treatment after experimental hypoxia-ischemia in neonatal rats alters the expression of HIF-1alpha and its downstream target genes. J Appl Physiol. 2006;101:853–865. - PubMed
    1. Calvert JW, Yin W, Patel M, Badr A, Mychaskiw G, Parent AD, Zhang JH. Hyperbaric oxygenation prevented brain injury induced by hypoxia-ischemia in a neonatal rat model. Brain Res. 2002;951:1–8. - PubMed

Publication types

MeSH terms