

Communicating side effect risks in a tamoxifen prophylaxis decision aid: the debiasing influence of pictographs
- PMID: 18602242
- PMCID: PMC2649664
- DOI: 10.1016/j.pec.2008.05.010
Communicating side effect risks in a tamoxifen prophylaxis decision aid: the debiasing influence of pictographs
Abstract
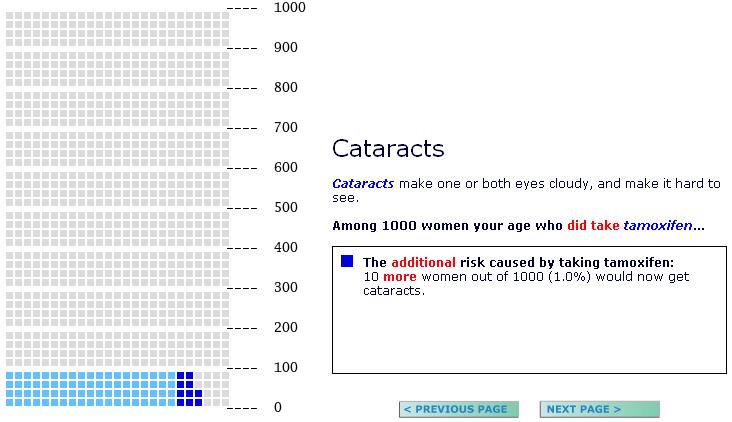
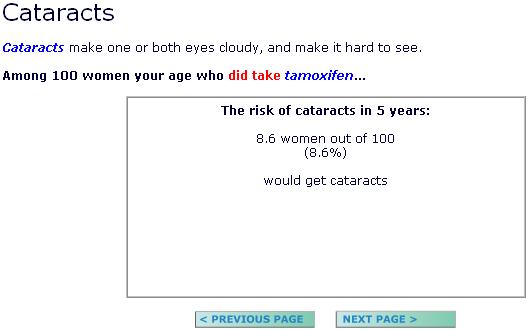
Objective: To experimentally test whether using pictographs (image matrices), incremental risk formats, and varied risk denominators would influence perceptions and comprehension of side effect risks in an online decision aid about prophylactic use of tamoxifen to prevent primary breast cancers.
Methods: We recruited 631 women with elevated breast cancer risk from two healthcare organizations. Participants saw tailored estimates of the risks of 5 side effects: endometrial cancer, blood clotting, cataracts, hormonal symptoms, and sexual problems. Presentation format was randomly varied in a three factor design: (A) risk information was displayed either in pictographs or numeric text; (B) presentations either reported total risks with and without tamoxifen or highlighted the incremental risk most relevant for decision making; and (C) risk estimates used 100 or 1000 person denominators. Primary outcome measures included risk perceptions and gist knowledge.
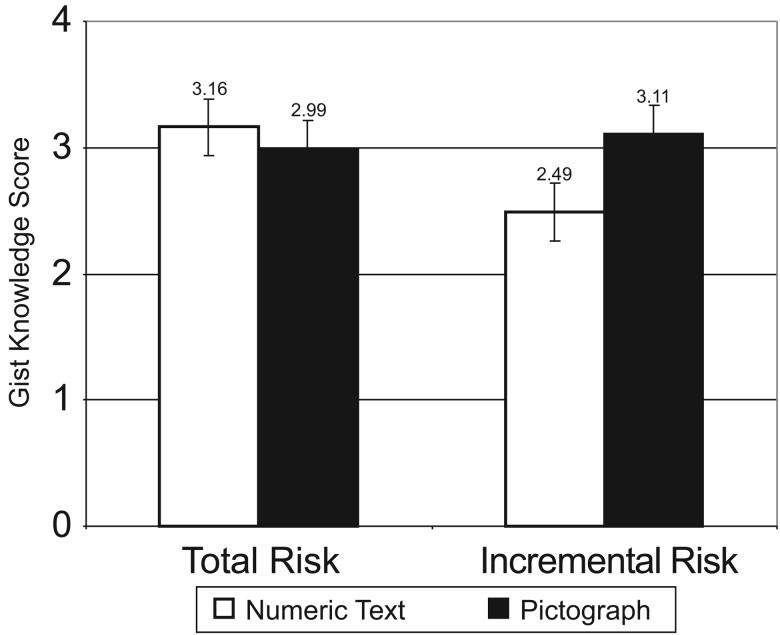
Results: Incremental risk formats consistently lowered perceived risk of side effects but resulted in low knowledge when displayed by numeric text only. Adding pictographs, however, produced significantly higher comprehension levels.
Conclusions: Pictographs make risk statistics easier to interpret, reducing biases associated with incremental risk presentations.
Practice implications: Including graphs in risk communications is essential to support an informed treatment decision-making process.
Figures
References
-
- O'Connor AM, Stacey D, Entwistle SD, Llewellyn-Thomas H, Rovner D, Holmes-Rovner M, et al. Decision aids for people facing health treatment or screening decisions. Cochrane Database Syst Rev. 2003:CD001431. - PubMed
-
- Fagerlin A, Rovner D, Stableford S, Jentoft C, Wei JT, Holmes-Rovner M. Patient education materials about the treatment of early-stage prostate cancer: A critical review. Annals of Internal Medicine. 2004;140(9):721–8. - PubMed
-
- Barry MJ. Health decision aids to facilitate shared decision making in office practice. Ann Intern Med. 2002;136(2):127–35. - PubMed
-
- Schapira MM, Davids SL, McAuliffe TL, Nattinger AB. Agreement between scales in the measurement of breast cancer risk perceptions. Risk Anal. 2004;24(3):665–73. 2004. - PubMed
Publication types
MeSH terms
Substances
Grants and funding
LinkOut - more resources
Full Text Sources
Medical
