A comparison of conventional cytology, DNA ploidy analysis, and fluorescence in situ hybridization for the detection of dysplasia and adenocarcinoma in patients with Barrett's esophagus
- PMID: 18602665
- PMCID: PMC2614867
- DOI: 10.1016/j.humpath.2008.02.003
A comparison of conventional cytology, DNA ploidy analysis, and fluorescence in situ hybridization for the detection of dysplasia and adenocarcinoma in patients with Barrett's esophagus
Abstract
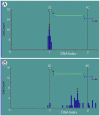
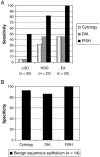
New detection methods with prognostic power are needed for early identification of dysplasia and esophageal adenocarcinoma (EA) in patients with Barrett's esophagus (BE). This study assessed the relative sensitivity and specificity of conventional cytology, DNA ploidy analysis with digital image analysis (DIA), and fluorescence in situ hybridization (FISH) for the detection of dysplasia and adenocarcinoma in endoscopic brushing specimens from 92 patients undergoing endoscopic surveillance for BE. FISH used probes to 8q24 (C-MYC), 9p21 (P16), 17q12 (HER2), and 20q13. Four-quadrant biopsies taken every centimeter throughout visible Barrett's mucosa were used as the gold standard. The sensitivity of cytology, DIA, and FISH for low-grade dysplasia was 5%, 5%, and 50%, respectively; for high-grade dysplasia (HGD), 32%, 45%, and 82%, respectively; and for EA, 45%, 45%, and 100%, respectively. FISH was more sensitive (P < .05) than cytology and DIA for low-grade dysplasia, HGD, and EA. The specificity of cytology, DIA, and FISH among patients (n = 14) with tissue showing only benign squamous mucosa was 93%, 86%, and 100% (P = .22), respectively. All patients with a polysomic FISH result had HGD and/or EA within 6 months (n = 33). There was a significant difference between FISH categories (negative, 9p21 loss, gain of a single locus, and polysomy) for progression to HGD/EA (P < .001). These findings suggest that FISH has high sensitivity for the detection of dysplasia and EA in BE patients, with the power to stratify patients by FISH abnormality for progression to HGD/EA. Additional studies are needed to further evaluate the clinical use of FISH.
Figures


References
-
- Bonino JA, Sharma P. Barrett’s esophagus. Curr Opin Gastroenterol. 2005;21:461–5. - PubMed
-
- Rex DK, Cummings OW, Shaw M, et al. Screening for Barrett’s esophagus in colonoscopy patients with and without heartburn. Gastroenterology. 2003;125:1670–7. - PubMed
-
- Cameron AJ, Ott BJ, Payne WS. The incidence of adenocarcinoma in columnar-lined (Barrett’s) esophagus. N Engl J Med. 1985;313:857–9. - PubMed
-
- Devesa SS, Blot WJ, Fraumeni JF., Jr Changing patterns in the incidence of esophageal and gastric carcinoma in the United States. Cancer. 1998;83:2049–53. - PubMed
-
- Sampliner RE, Practice Parameters Committee of the American College of G Updated guidelines for the diagnosis, surveillance, and therapy of Barrett’s esophagus. Am J Gastroenterol. 2002;97:1888–95. - PubMed
Publication types
MeSH terms
Substances
Grants and funding
LinkOut - more resources
Full Text Sources
Other Literature Sources
Medical
Research Materials
Miscellaneous

