. 2008 Aug;11(8):974-82.
doi: 10.1038/nn.2147. Epub 2008 Jul 6.

Task difficulty modulates the activity of specific neuronal populations in primary visual cortex

Affiliations

Task difficulty modulates the activity of specific neuronal populations in primary visual cortex

Yao Chen et al. Nat Neurosci. 2008 Aug.

Abstract

Spatial attention enhances our ability to detect stimuli at restricted regions of the visual field. This enhancement is thought to depend on the difficulty of the task being performed, but the underlying neuronal mechanisms for this dependency remain largely unknown. We found that task difficulty modulates neuronal firing rate at the earliest stages of cortical visual processing (area V1) in monkey (Macaca mulatta). These modulations were spatially specific: increasing task difficulty enhanced V1 neuronal firing rate at the focus of attention and suppressed it in regions surrounding the focus. Moreover, we found that response enhancement and suppression are mediated by distinct populations of neurons that differ in direction selectivity, spike width, interspike-interval distribution and contrast sensitivity. Our results provide strong support for center-surround models of spatial attention and suggest that task difficulty modulates the activity of specific populations of neurons in the primary visual cortex.


Figures

Figure 1
Figure 1. Behavioral task and attentional response ratios measured in V1 single cells during hard and easy tasks
(a) Temporal structure of a trial. Two rhesus monkeys were trained to fixate a small cross while covertly attending to a spatial location that was cued at the beginning of each trial. The cue was a thin red ring with a diameter 3 times larger than the diameter of the neuronal receptive field (RF). Following the cue, drifting gratings were presented simultaneously at 5 different spatial locations for 1.5–3 seconds. Following a randomized period of time, one of the gratings changed color/luminance and the animal was tasked with detecting the change by releasing a bar within 0.5 seconds. The attentional modulations were measured at the last cycle of the drifting grating before the color change. (b) The color change could be easy or hard to detect, and could occur inside or outside the receptive field. (c) The number of cells that were significantly modulated by attention (shown in red) was much lower during the easy task (top) than during the hard task (bottom). Eight cells were significantly modulated by attention during both the easy and the hard task.
Figure 2
Figure 2. Examples of two V1 cells whose responses were modulated by task difficulty and spatial attention
(a) Cell showing response enhancement with increasing task difficulty. The response enhancement was stronger when spatial attention was located inside the receptive field (left) as opposed to outside (right). The peristimulus time histograms (PSTHs) show visual responses 500 ms before the grating changed color (the last cycle of the drifting grating). The bar graphs on the top right corner of the PSTHs show the average firing rate and standard error (s.e.m.) measured from the PSTHs. The standard error is defined as one standard deviation divided by the square root of the sample size. The star indicates P < 0.05, Wilcoxon test. This cell was tested with three different levels of difficulty. The region below the PSTHs shows the spike waveforms, ISI (interspike interval distribution obtained with drifting gratings), receptive field measured with reverse correlation, orientation tuning and spatial frequency tuning. (b) Cell showing strong response suppression with increasing task difficulty. When spatial attention was outside the receptive field, the cell response was significantly stronger during the easy task than the hard task (66 versus 45 spikes per s, P = 0.009, Wilcoxon test). Notice than during the easy task, this cell seemed to respond more strongly when attention was outside versus inside the receptive field, however, the difference was not significant (61 versus 66 spikes per s, P = 0.57, Wilcoxon test).
Figure 3
Figure 3. Spatial attention and task difficulty modulations of V1 visual responses
(a) The attentional ratio (AR) was independently calculated for the hard task (x axis) and easy task (y axis) as AR= (I − O)/(I + O), where I is the visual response when spatial attention was inside the receptive field (RF) and O the visual response when spatial attention was outside the receptive field. During the easy task, some cells (including cell in Fig. 2b) had negative attentional ratios indicating stronger responses when attention was located outside versus inside the receptive field, however, all attentional ratios were positive during the hard task. The arrows indicate the average ratio and standard error (s.e.m.) for each condition. (b) Difficulty ratio (DR) calculated independently when spatial attention was inside or outside the receptive field as DR = (H − E)/(H + E), where H is the visual response during the hard task and E is the visual response during the easy task. (c) Response change (RC) with increasing task difficulty, calculated independently when spatial attention was inside and outside the receptive field as RC = (H − E)/E. There was a positive correlation between the RC measured when spatial attention was inside and outside the receptive field. Open circles in the three plots (a, b, c) mark the cells illustrated in Figure 2 (the neuron illustrated in Fig. 2b has the lower Y-axis values in the three plots).
Figure 4
Figure 4. Modulation by task difficulty in V1 cells
The graphs on the left show normalized visual responses summed across the two spatial locations of attention, for the easy task (Easy I + O) and the hard task (Hard I + O). This graph includes all cells that were significantly modulated by spatial attention as defined in Fig. 1c. The graphs on the middle and right show the direction selectivity, spike width and interspike interval distribution of eight cells chosen as representative examples (including the cells illustrated in Fig. 2). (a) Cells that enhanced visual responses when task difficulty was increased. (b) Cells that suppressed visual responses when task difficulty was increased.
Figure 5
Figure 5. Response modulations to spatial attention and task difficulty are correlated with the direction selectivity, spike width, interspike interval and contrast sensitivity of the cell
A summed difficulty ratio (DRs) was calculated as (Hs − Es)/(Hs + Es), where Hs is the visual response during the hard task and Es the visual response during the easy task (summed across I and O conditions). (a) Negative correlation between DRs and direction selectivity. (b) Negative correlation between DRs and spike width. (c) Positive correlation between DRs and the peak of the interspike interval distribution (ISI peak). (d) Positive correlation between DRs and the stimulus contrast that generated 50% of the maximum response (C50). The spike width was measured from the beginning of the first phase of the spike waveform to the peak of the second phase. The ISI peak was measured as the ISI interval at the peak of ISI distribution obtained with drifting gratings (with a bin width of 1 ms). Blue and red circles illustrate difficulty-suppressed neurons and difficulty-enhanced neurons respectively.
Figure 6
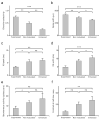
Figure 6. Response properties that distinguish V1 cells classified as difficulty-suppressed (summed difficulty ratio < 0), difficulty-enhanced (summed difficulty ratio > 0) and non-modulated (no significant modulation by spatial attention as defined in Fig. 1c)
. Bar graphs represent the average direction selectivity (a), spike width (b), ISI peak (c), ISI width (d), spontaneous activity (e) and contrast at half-maximum response (C50) (f) for each cell group. Standard errors are defined as in Figure 2. ***, P < 0.001; **, P < 0.005; *, P < 0.05; ns, not significant (Mann-Whitney test).
Figure 7
Figure 7. The magnitude of the visual responses was correlated with the level of task difficulty
(a) Normalized firing rate of difficulty-enhanced neurons measured at different levels of difficulty when attention was inside (left) and outside (right) the receptive field. The visual responses of the difficulty-enhanced neurons were positively correlated with task difficulty only when attention was located inside the receptive field (r = 0.69, P < 0.0001). (b) Normalized firing rate of difficulty-suppressed neurons. The visual responses of difficulty-suppressed neurons were negatively correlated with task difficulty only when spatial attention was located outside the receptive field (r = −0.82, P < 0.0001).

Comment in

References

    1. Posner MI. Orienting of attention. Q J Exp Psychol. 1980;32:3–25. - PubMed
    1. Carrasco M, McElree B. Covert attention accelerates the rate of visual information processing. Proc Natl Acad Sci U S A. 2001;98:5363–5367. - PMC - PubMed
    1. Pestilli F, Carrasco M. Attention enhances contrast sensitivity at cued and impairs it at uncued locations. Vision Res. 2005;45:1867–1875. - PubMed
    1. Lu ZL, Dosher BA. External noise distinguishes attention mechanisms. Vision Res. 1998;38:1183–1198. - PubMed
    1. Lavie N, Cox S. On the efficiency of visual selective attention: efficient visual search leads to inefficient distractor rejection. Psychological Science. 1997;8:395–398.

Publication types