. 2008 Jul 4;4(7):e1000111.
doi: 10.1371/journal.pgen.1000111.

Identification of neural outgrowth genes using genome-wide RNAi

Affiliations

Identification of neural outgrowth genes using genome-wide RNAi

Katharine J Sepp et al. PLoS Genet. .

Abstract

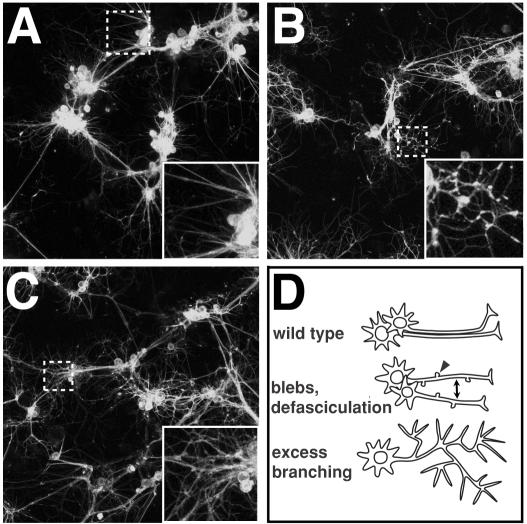
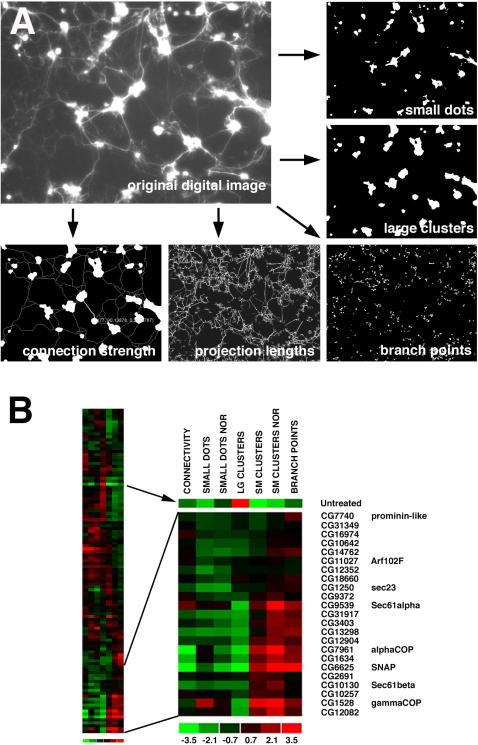
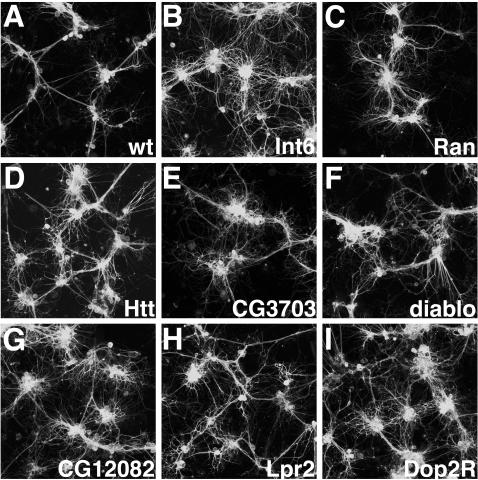
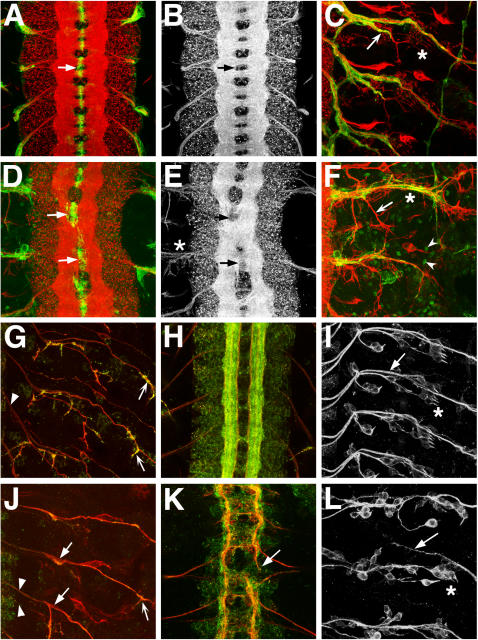
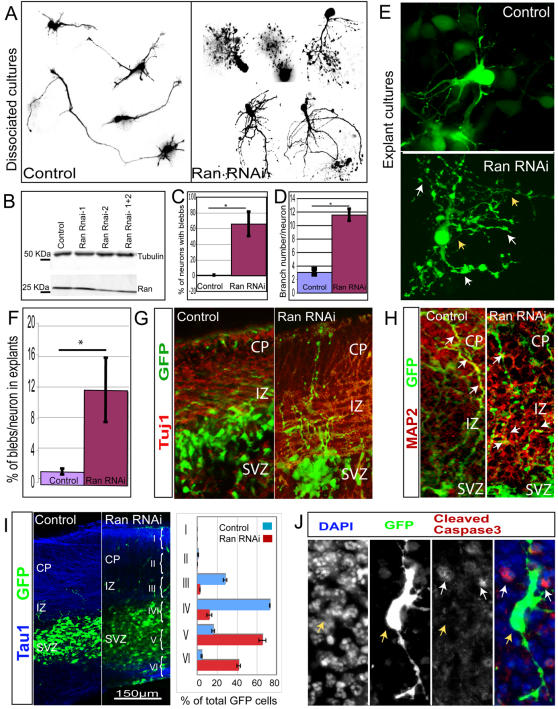
While genetic screens have identified many genes essential for neurite outgrowth, they have been limited in their ability to identify neural genes that also have earlier critical roles in the gastrula, or neural genes for which maternally contributed RNA compensates for gene mutations in the zygote. To address this, we developed methods to screen the Drosophila genome using RNA-interference (RNAi) on primary neural cells and present the results of the first full-genome RNAi screen in neurons. We used live-cell imaging and quantitative image analysis to characterize the morphological phenotypes of fluorescently labelled primary neurons and glia in response to RNAi-mediated gene knockdown. From the full genome screen, we focused our analysis on 104 evolutionarily conserved genes that when downregulated by RNAi, have morphological defects such as reduced axon extension, excessive branching, loss of fasciculation, and blebbing. To assist in the phenotypic analysis of the large data sets, we generated image analysis algorithms that could assess the statistical significance of the mutant phenotypes. The algorithms were essential for the analysis of the thousands of images generated by the screening process and will become a valuable tool for future genome-wide screens in primary neurons. Our analysis revealed unexpected, essential roles in neurite outgrowth for genes representing a wide range of functional categories including signalling molecules, enzymes, channels, receptors, and cytoskeletal proteins. We also found that genes known to be involved in protein and vesicle trafficking showed similar RNAi phenotypes. We confirmed phenotypes of the protein trafficking genes Sec61alpha and Ran GTPase using Drosophila embryo and mouse embryonic cerebral cortical neurons, respectively. Collectively, our results showed that RNAi phenotypes in primary neural culture can parallel in vivo phenotypes, and the screening technique can be used to identify many new genes that have important functions in the nervous system.


Conflict of interest statement

The authors have declared that no competing interests exist.

Figures

Figure 1
Figure 1. Morphological phenotype features and gene classes observed in RNAi screen.
(A–C) Confocal micrographs of live, GFP-labeled neurons and glia. Inset on bottom right hand corner is enlargement of dotted small box areas in same image. (A) Wild-type (no dsRNA) control culture shows well fasciculated cell processes connecting cell body clusters. (B) Hydrogen-transporting ATPase VhaAC39 dsRNA treated cells show increased varicosities (blebs) along cell processes, and excessive branching relative to controls. (C) Novel gene CG14883 dsRNA treated cells show a combination of excessive branching and defasciculation. (D) Cartoon of axon morphologies in wild-type, and RNAi-treated cells. Wild-type axons emanating from neurons in the same cell body cluster often extend together in bundles (top). Axonal blebs are indicated with arrowhead and lack of bundling (defasciculation) is indicated by double-ended arrow.
Figure 2
Figure 2. Quantification of RNAi phenotypes and cluster analysis.
(A) Screen images acquired on a robotic widefield fluorescence microscope were analyzed by custom image analysis software. Image features relating to the health of the cultures were extracted using filters that measured the amount of small dots (indicator of debris and blebbing), small, medium and large cell clusters, lengths of processes and numbers of branch points, and the strength of connectivity between large cell clusters. Indicators of weaker primary neural health are decreased sizes of cell clusters, increased branch points, decreased projection lengths, and decreased interconnectivity between cell clusters. (B) For each image feature quantified in (A), heat map representation values were assigned to each of the quantified features, where increased values are in red and decreased values are in green. All the quantified image features for each gene were assembled into a single profile and the profiles were ordered into a hierarchical cluster as shown. Normalized (NOR) feature quantifications are included. Protein and vesicle trafficking genes were largely located to the bottom region of the hierarchy as shown in highlighted region.
Figure 3
Figure 3. Confocal micrographs of live GFP-labeled primary neural cultures treated with dsRNAs showing altered cell morphologies.
All cultures were grown on glass coverslips coated with poly-L-lysine. (A) Wild type (negative control). Wild type primary neurons in a mature culture show cell body clusters interconnected by well-fasciculated axon tracts. (B) Int6 transcription initiation factor knockdowns show extensive defasciculation. (C) Ran GTPase RNAi cultures have both excessive branching and defasciculation. (D) Huntingtin knockdowns show a moderate level of excessive branching. (E) Sec61α RNAi shows poor connectivity between cell clusters and highly branched, defasciculated neurons. (F) Diablo (cytoskeletal binding protein). Diablo knockdown leads to a primarily defasciculated phenotype. (G) CG12082 (novel gene) RNAi causes reduced connectivity between cel clusters, excessive branching and defasciculation. (H) Lpr2 LDL receptor knockdowns show excessive branching and defasciculation, yet with robust outgrowth. (I) Dopamine 2-like Receptor RNAi shows defasciculation.
Figure 4
Figure 4. Phenotypes of wild type and Sec61α mutant embryonic nervous systems.
(A–C, G–I) Wild type. (D–F) Sec61αSH190 homozygous mutant. (J–L) Sec61αk04917 homozygous mutant. Anterior is to the top. PNS images have CNS off to the left in C,F,G,I,J,L. (A–C) Neurons are labeled with anti-HRP (red) and glia are labeled with mAb 5B12 (green). (G,H,J,K) Motor neurons labeled with mAb 1D4 (red) and anti-Synaptotagmin-1 (green). (I,L) Sensory neurons labeled with mAb 22C10. All embryos are late embryonic stage, approximately 22 hours old. (A) Wild-type CNS shows ladder-like pattern of axon tracts with commissural tracts ensheathed by midline glia (arrow). (B) Red channel (neurons) only of (A). (C) Wild-type PNS shows stereotypic pattern of motor- and sensory neuron projections (red) and coverage of nerve tracts by peripheral glia (green). SNa branch is indicated with arrow. (D) Sec61α embryos show disruption of CNS axon tract pattern (see also E), with glial profiles displaced compared to wild type (arrows). The confocal laser power relative to that used for imaging the wild type was increased to show glial staining pattern. (E) Neurons from (D) shown, highlighting lack of separation of central commissures (arrows). Defasciculation of peripheral axon projections at the CNS/PNS transition zone (asterisk) is also evident. (F) Sec61α mutant PNS shows variable disruption of axon patterning across hemisegments. Poor glial coverage of mistargeted SNa branch is indicated (arrow). Ectopic expression of mAb5B12 antigen is observed in the periphery (arrowheads). (G) Wild type PNS motor neuron pattern (red). Peripheral nerves near CNS/PNS transition zone are well fasciculated and tightly bundled (arrowhead). Synaptotagmin-1 is strongly detected at motor axon termini (arrows). (H) Wild type CNS motor neuron pattern (red) and distribution of synapse marker Synaptotagmin-1 (green). (I) Wild type PNS sensory neuron pattern. Arrow shows Anterior Fascicle sensory neuron tract pathway leading towards CNS on the left. (J) Sec61αk04917 mutant PNS motor neuron pattern (red) shows defasciculation (solid arrows) and lack of Synaptotagmin-1 immunolabeling (green) at motor axon termini (concave arrow) compared to wild type (G, concave arrows). (K) Sec61αk04917 mutant CNS motor neuron pattern (red) shows lack of development of CNS compared to same age wild type embryo (H). CNS axon pathfinding is disrupted along longitudinal connectives (arrow). (L) Sec61αk04917 mutant PNS sensory neuron pattern shows Anterior Fascicle sensory nerve aberrantly crossing hemisegment boundary anteriorly (arrow, compare to (I)). Round sensory neuron cell bodies are disorganized compared to stereotypic wild type pattern. (C, F, I, L) Asterisks indicate lateral chordotonal organs, which are disorganized in both Sec61αk04917 (L) and Sec61αSH190 (F) alleles compared to wild types (C, I).
Figure 5
Figure 5. Ran knock down by RNAi results in abnormal neurite morphology in mouse neurons.
(A) Cortices from E14 embryos were transfected by electroporation with either a control GFP plasmid or Ran RNAi contructs, and then dissociated and cultured for 96 hours. Analysis of dissociated neuron morphology shows Ran RNAi neurons have increased number of blebs and branches (right panel) compared to control neurons (left panel). (B) Ran knockdown in nih-3T3 cells transfected with control GFP vector and Ran RNAi constructs. Equal loadings of total protein shown by tubulin signal demonstrates a decrease in the amount of Ran by about 50% in the presence of Ran Rnai-2 and when the two constructs are combined. (C) Analysis of the increase in the number of blebs in dissociated neurons. A significant increase in the number of blebs is observed upon Ran knockdown (p = 0.02). The average number of neurons with blebs is presented as percentage of the total neuron number (Control = 0.68+/−1.2 SDEV, n = 153; Ran = 66.7+/−15.5 SDEV, n = 36). (D) Analysis of the branching phenotype in dissociated neurons show a very significant increase of branching (p<0.0001) upon Ran knockdown (11.56+/−0.88 SEM n = 17) compared to the control neurons (3.07+/−0.41 SEM n = 24). (E) A Z-series reconstruction of a Ran RNAi neuron (lower panel) shows an abnormal increase in branch arborization of the processes (yellow arrows) and bleb number (white arrows) compared to the control (upper panel). (F) Analysis of bleb number in explant cultures. The total number of blebs and cell nuclei were counted per section for three independent experiments. The average ratio of bleb per nuclei (shown as a percentage) is significantly increased (p = 0.0007) in the Ran RNAi explants (12.6+/−4.2 SEM) compared to the control explants (1.7+/−0.4). (G) Ran RNAi neurons labeled with GFP (green) have processes that are immunoreactive for the neuronal marker Tuj1 (in red) (2nd panel) similar to control neurons (1st panel). (H) MAP2 (red), a dendritic marker presents smaller areas of colocalization with GFP (green) in Ran RNAi neurons (right panel) compared to control (left panel) white arrows indicate areas of colocalization. (I) Analysis with TAU1 (blue) shows Control (left panel) and Ran RNAi (right panel) neurons labeled with GFP (green). Quantitation of GFP cell distribution in electroporated explants shows the percentage of total cells counted per Bin, a representative experiment is shown (error bars are standard error of the mean SEM). Control Bins: II = 0.7+/−0.3; III = 22.9+/−1.5; IV = 59.6+/−0.2; V = 13.1+/−1.2; VI = 3.6+/−0.5. Ran RNAi Bins: II = 0.1+/−0.08; III = 2.3+/−0.06; IV = 9.9+/−2.1; V = 53.6+/−2.9; VI = 34.1+/−1.5. (J) Analysis of cell death in explants with anti-Cleaved Caspase3 (red) immunoreactivity shows that Ran RNAi electroporated GFP neurons (yellow arrows) do not colocalize with anti-Cleaved Caspase3 (white arrows).

References

    1. Schmid A, Schindelholz B, Zinn K. Combinatorial RNAi: a method for evaluating the functions of gene families in Drosophila. Trends Neurosci. 2002;25:71–74. - PubMed
    1. Ivanov AI, Rovescalli AC, Pozzi P, Yoo S, Mozer B, et al. Genes required for Drosophila nervous system development identified by RNA interference. Proc Natl Acad Sci U S A. 2004;101:16216–16221. - PMC - PubMed
    1. Mello CC, Conte D., Jr Revealing the world of RNA interference. Nature. 2004;431:338–342. - PubMed
    1. Tijsterman M, Plasterk RH. Dicers at RISC; the mechanism of RNAi. Cell. 2004;117:1–3. - PubMed
    1. Carpenter AE, Sabatini DM. Systematic genome-wide screens of gene function. Nat Rev Genet. 2004;5:11–22. - PubMed

Publication types

LinkOut - more resources