. 2008 Jul 4;4(7):e1000113.
doi: 10.1371/journal.pgen.1000113.

Pervasive and persistent redundancy among duplicated genes in yeast

Affiliations

Pervasive and persistent redundancy among duplicated genes in yeast

E Jedediah Dean et al. PLoS Genet. .

Abstract

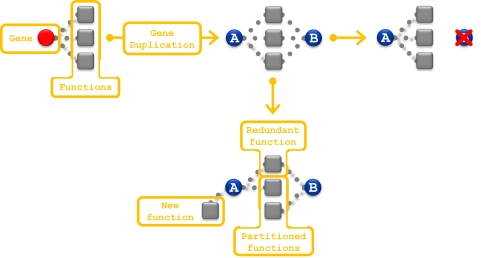
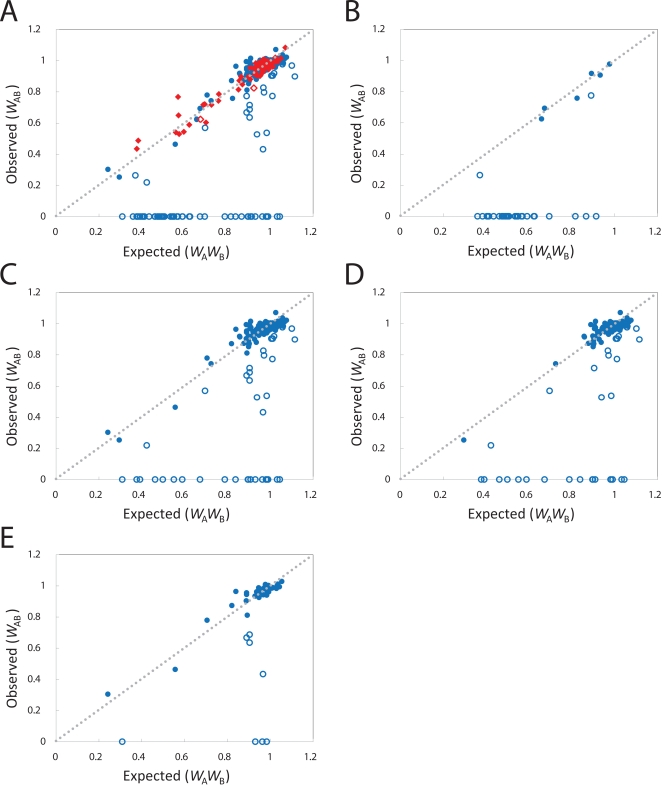
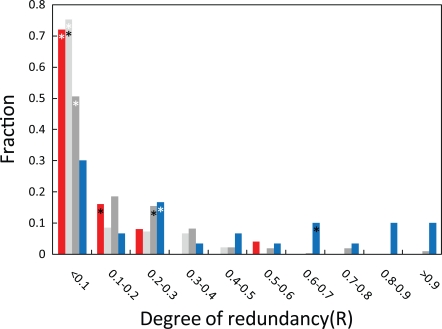
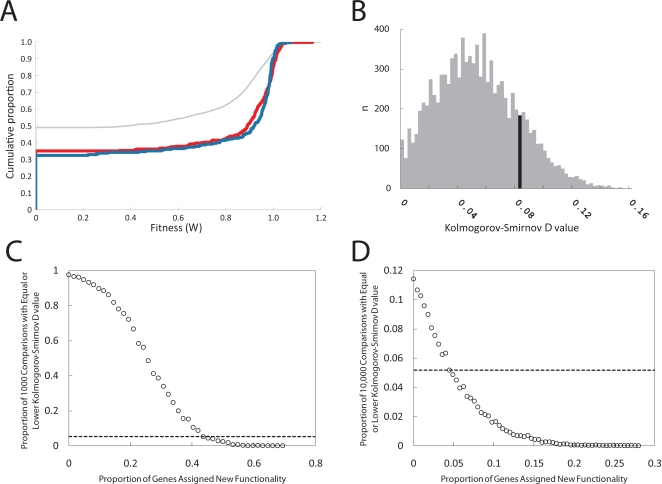
The loss of functional redundancy is the key process in the evolution of duplicated genes. Here we systematically assess the extent of functional redundancy among a large set of duplicated genes in Saccharomyces cerevisiae. We quantify growth rate in rich medium for a large number of S. cerevisiae strains that carry single and double deletions of duplicated and singleton genes. We demonstrate that duplicated genes can maintain substantial redundancy for extensive periods of time following duplication ( approximately 100 million years). We find high levels of redundancy among genes duplicated both via the whole genome duplication and via smaller scale duplications. Further, we see no evidence that two duplicated genes together contribute to fitness in rich medium substantially beyond that of their ancestral progenitor gene. We argue that duplicate genes do not often evolve to behave like singleton genes even after very long periods of time.


Conflict of interest statement

The authors have declared that no competing interests exist.

Figures

Figure 1
Figure 1. Models for the evolutionary trajectory of a duplicate pair.
The squares represent functions and the circles represent genes. Dotted lines connect genes to functions with which they are associated. In this example the ancestral gene was associated with three functions. Following the gene duplication, the duplicate genes (genes A and B) are redundant for all three functions. Because of this redundancy, one copy is likely to be lost by means of an inactivating mutation, as shown in the outcome on the right. The lower outcome illustrates several other possibilities. Here, each duplicate gene has gained non-redundant functionality and now the pair is likely to persist. In this example some of the ancestral function is partitioned between the two duplicates, a redundant function is retained by both, and one of the duplicates (A) has gained new functionality.
Figure 2
Figure 2. Comparing single gene to double gene deletion fitness values.
(A) The observed double gene deletion fitness values (W AB) are graphed against the expected double gene deletion fitness values (W A W B) for the full set of 90 paired singleton genes (red diamonds) and 201 duplicate gene pairs (blue circles), (B) for ribosomal duplicate gene pairs, (C) for non-ribosomal duplicate gene pairs, (D) for non-ribosomal duplicate gene pairs from the WGD event, and (E) for non-ribosomal duplicate gene pairs from SSD events. The open symbols indicate pairs in which W AB is significantly lower than W A W B (Student's t test, P<0.025). The grey dotted line indicates a slope of 1 and an intercept of 0 (or W A W B = W AB). The pairs in which a single gene deletion is lethal (W A or W B = 0) were excluded from these figures. Within all of the classes of duplicated genes observed, a significant proportion of pairs show evidence of redundancy. No evidence of redundancy is observed among singleton pairs.
Figure 3
Figure 3. Determining the degree of redundant function within duplicate gene pairs.
The histogram shows the degree of redundancy (R = (W A W BW AB)/(1−W AB)) within the set of singleton gene pairs (red), the duplicate gene pairs (blue bars), as well as for the MMS genes when grown in the presence (light grey) and absence (dark grey) of the drug MMS. The white and black asterisks mark the locations of the 50th and 75th percentile values in the figure. The degree of redundancy observed among the duplicate genes is greater than that observed among the singleton gene pairs as well as among the MMS gene pairs grown either in the presence or in the absence of MMS.
Figure 4
Figure 4. Testing for evidence of gained functionality.
(A) The figure shows the empirical cumulative distribution of the fitness values for strains carrying single gene deletions of the singleton genes of the proxy set (red) and strains carrying double gene deletions of duplicate genes (W AB) (blue). We also include the empirical cumulative distribution of the expected fitness values for all possible double deletions of paired singleton genes from the proxy set (non-ribosomal and ribosomal genes are handled separately, and the proportions are balanced to match that observed among the duplicate gene pairs) (grey). (B) A histogram of 10,000 Kolmogorov-Smirnov D values derived from permutations of the data from the proxy set and the set of duplicate genes shown in (A). For the actual distributions of the sets in (A), the Kolmogorov-Smirnov D = 0.08. This observed value falls within the black bar on the histogram displaying the 10,000 D values derived from permutations of the data in (A). This corresponds to P = 0.25 (see Table 1), and indicates that we cannot distinguish these two distributions statistically. (C)(D) Here we assess the sensitivity of our tests for new functionality by building surrogate sets to simulate gained functionality. For each level of gained functionality we constructed 10,000 surrogate sets each simulating a specific amount of gained functionality (see text). We determined the Kolmogorov-Smirnov D value between each of the surrogate sets of fitness values and the observed distribution of fitness values for the genes in the proxy set. Here we show how many of the 10,000 comparisons produced a Kolmogorov-Smirnov D value that are less than or equal to our observed value of 0.08 (C). We also show how many of the 10,000 comparisons produced Kolmogorov-Smirnov D values equal to our observed value of 0 when fitness values above 0.98 are ignored (D).

Similar articles

Cited by

References

    1. Ohno S. Evolution by gene duplication. Berlin, New York: Springer-Verlag; 1970. p. xv, 160.
    1. Lynch M, O'Hely M, Walsh B, Force A. The probability of preservation of a newly arisen gene duplicate. Genetics. 2001;159:1789–1804. - PMC - PubMed
    1. Force A, Lynch M, Pickett FB, Amores A, Yan YL, et al. Preservation of duplicate genes by complementary, degenerative mutations. Genetics. 1999;151:1531–1545. - PMC - PubMed
    1. Lynch M, Force A. The probability of duplicate gene preservation by subfunctionalization. Genetics. 2000;154:459–473. - PMC - PubMed
    1. Gu Z, Steinmetz LM, Gu X, Scharfe C, Davis RW, et al. Role of duplicate genes in genetic robustness against null mutations. Nature. 2003;421:63–66. - PubMed

Publication types

LinkOut - more resources