. 2008 Sep;190(2):135-51.
doi: 10.1007/s00221-008-1455-0. Epub 2008 Jul 5.

Relation of frontal eye field activity to saccade initiation during a countermanding task

Affiliations

Relation of frontal eye field activity to saccade initiation during a countermanding task

Joshua W Brown et al. Exp Brain Res. 2008 Sep.

Abstract

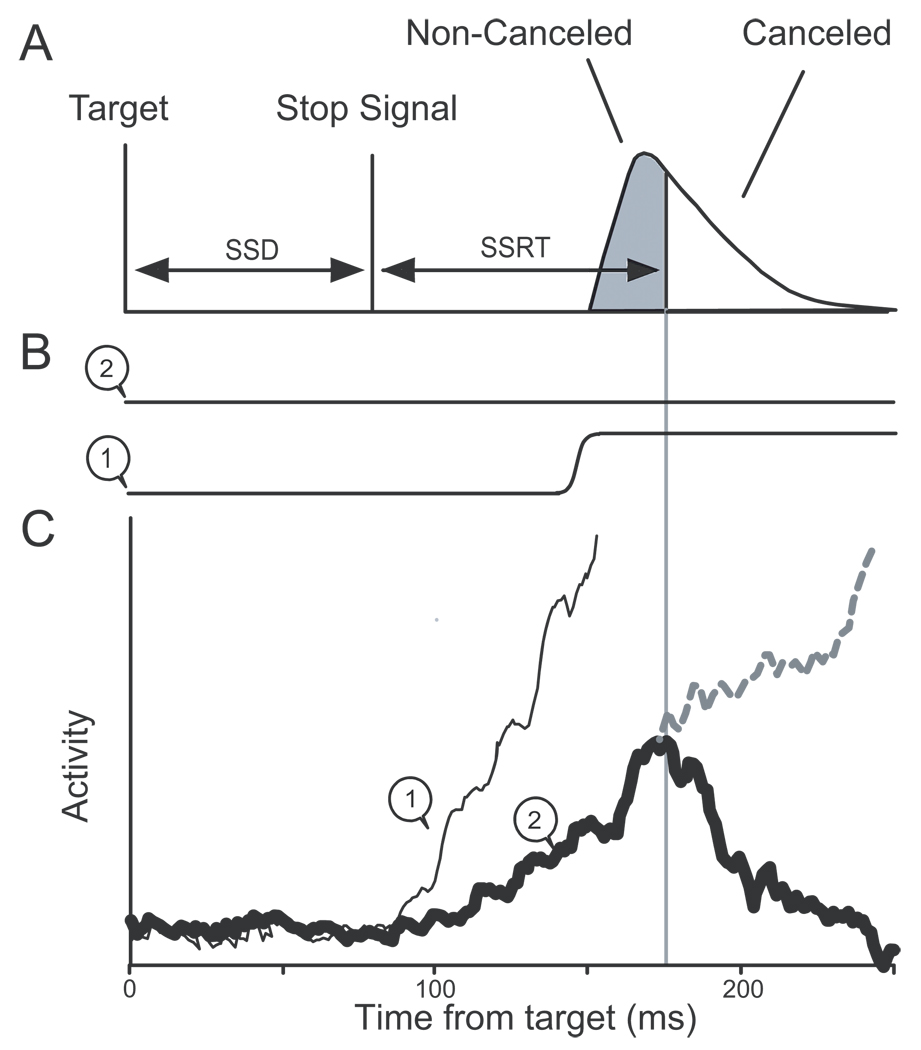
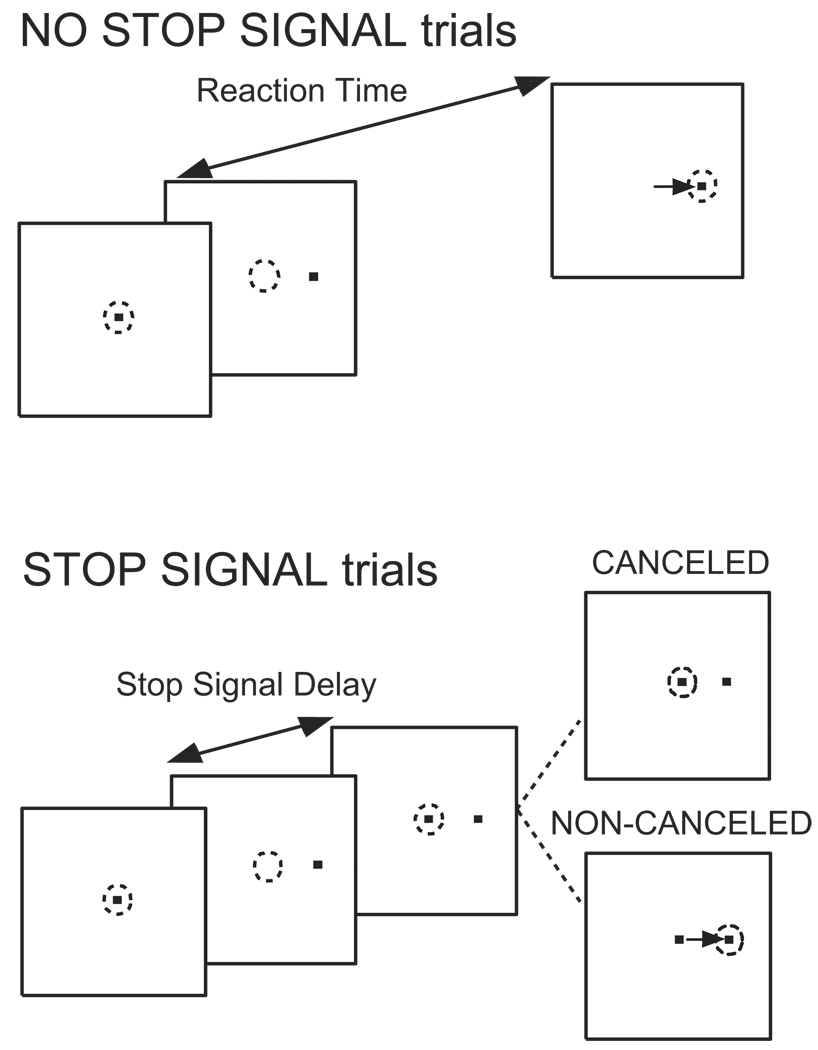
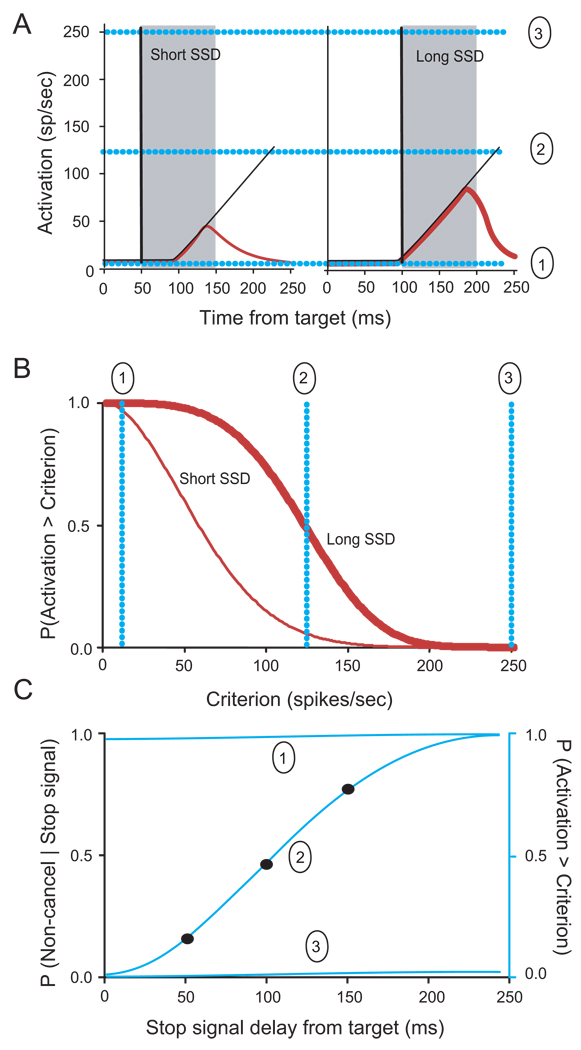
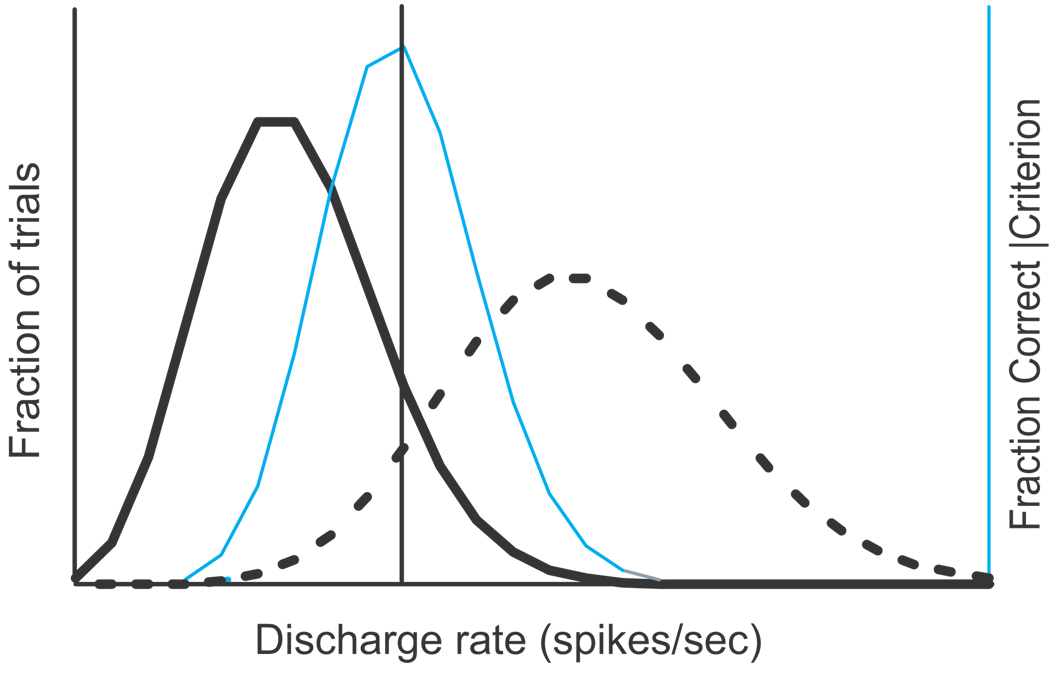
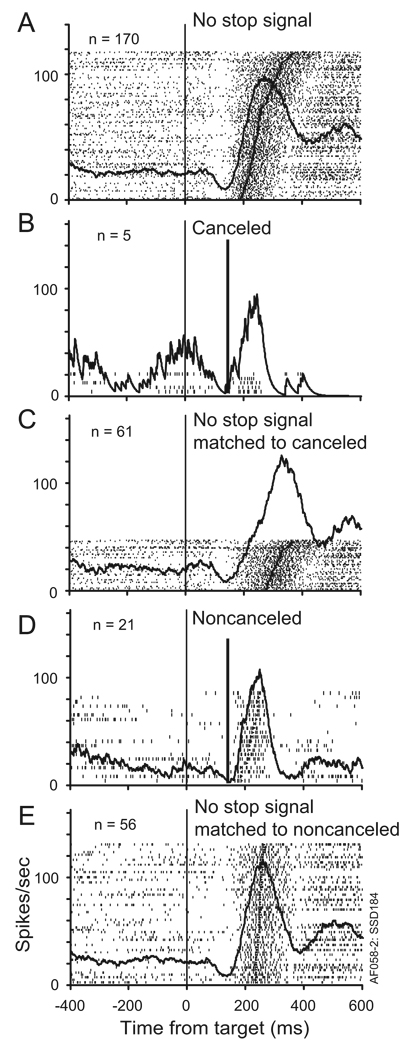
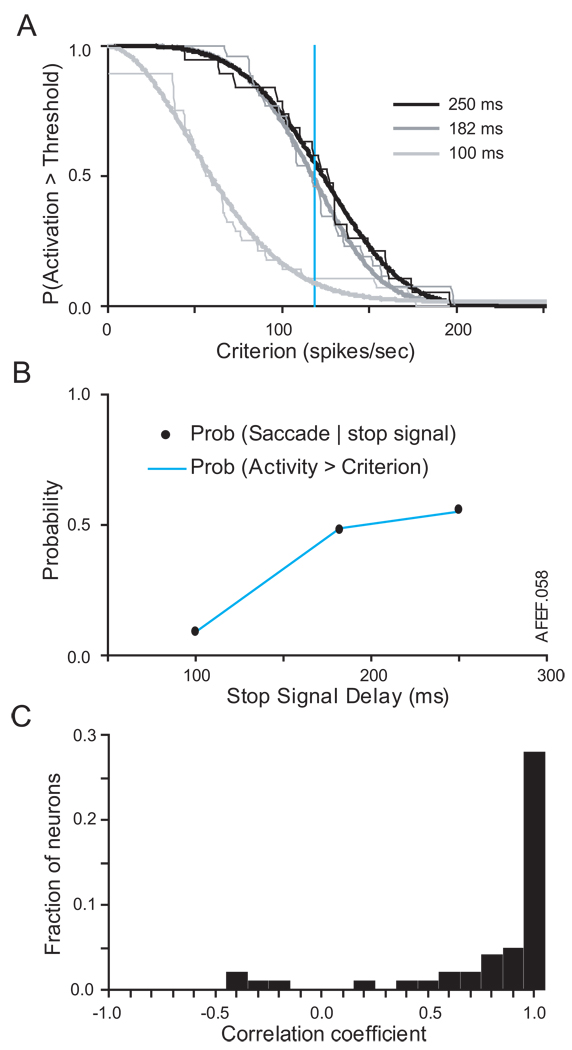
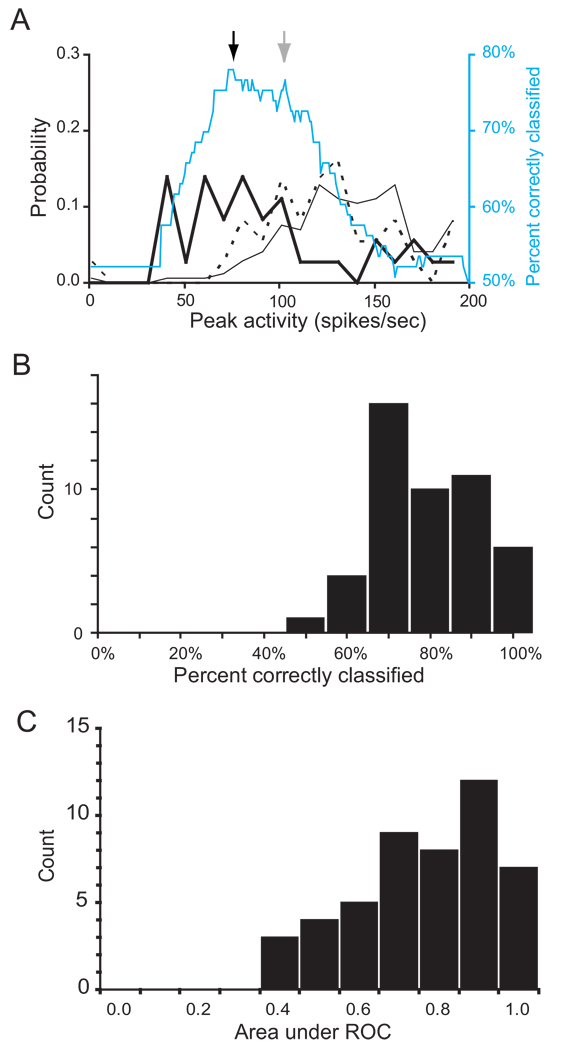
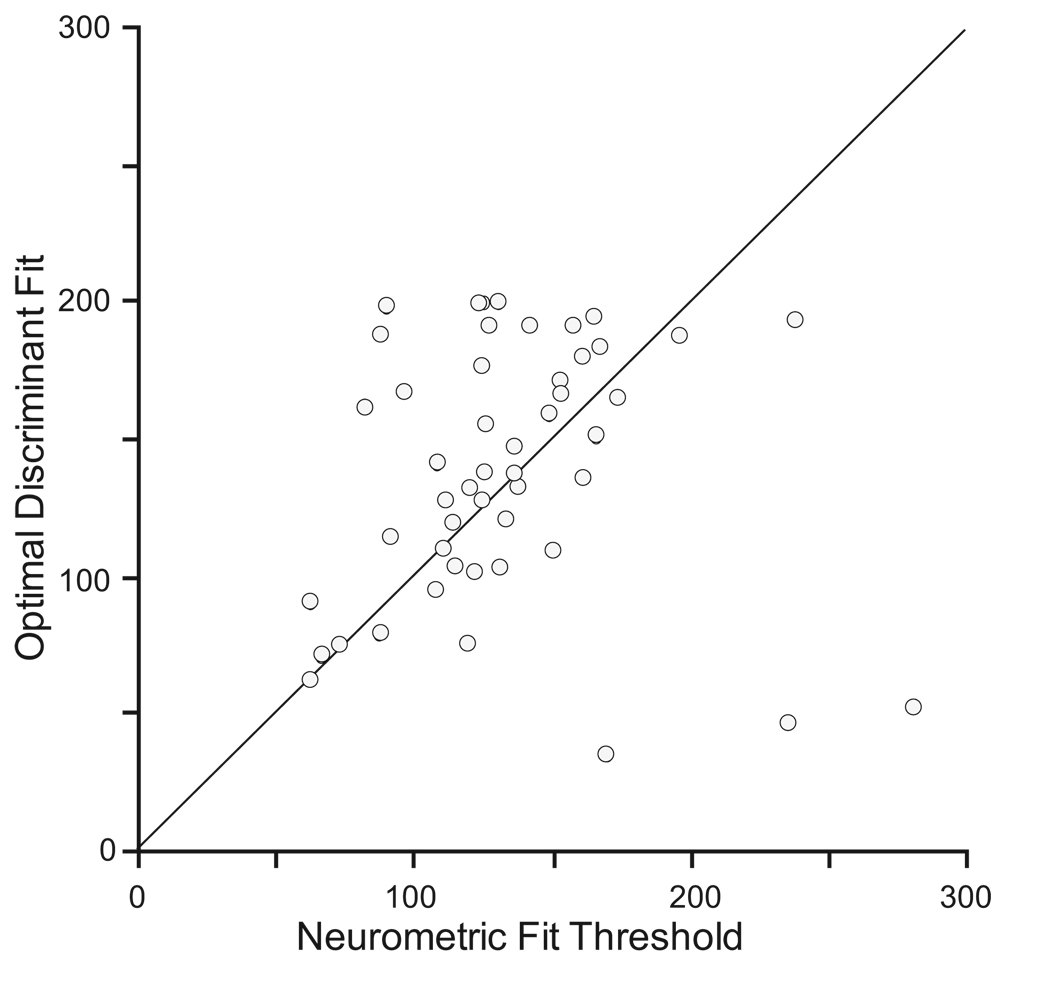
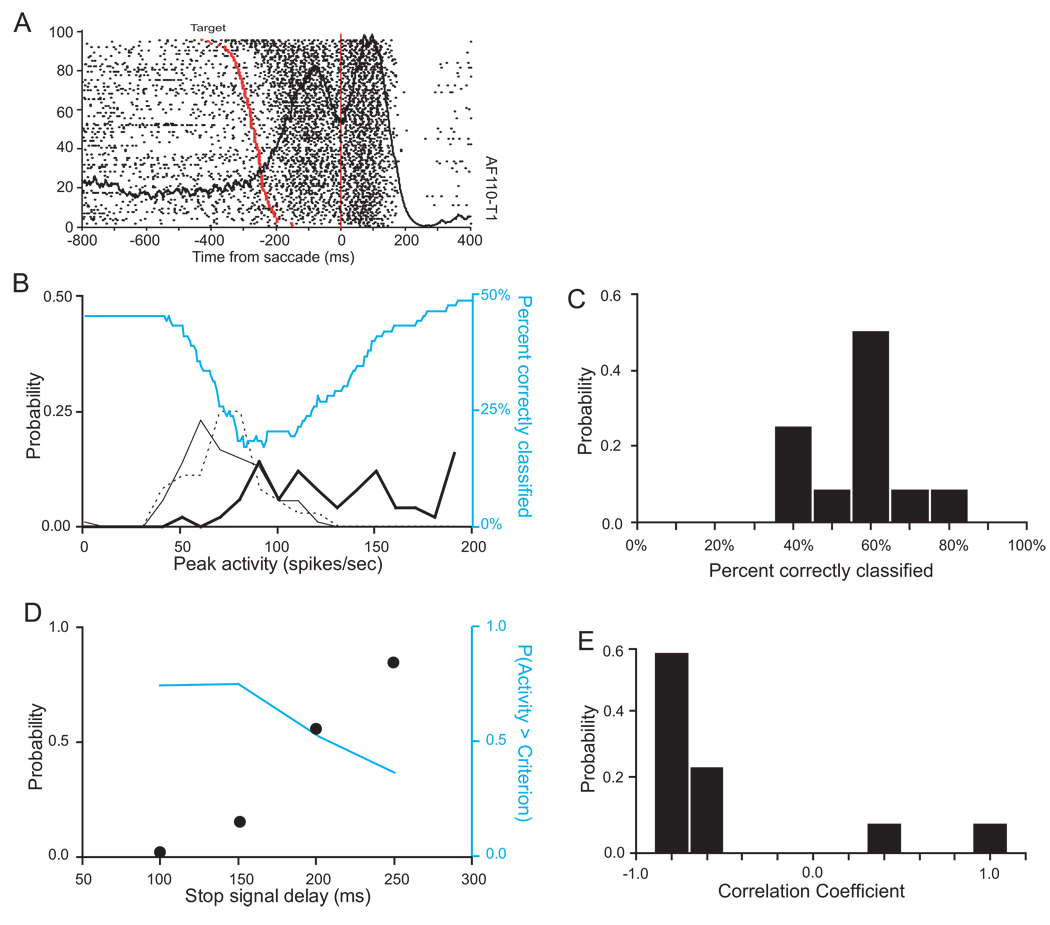
The countermanding (or stop signal) task probes the control of the initiation of a movement by measuring subjects' ability to withhold a movement in various degrees of preparation in response to an infrequent stop signal. Previous research found that saccades are initiated when the activity of movement-related neurons reaches a threshold, and saccades are withheld if the growth of activity is interrupted. To extend and evaluate this relationship of frontal eye field (FEF) activity to saccade initiation, two new analyses were performed. First, we fit a neurometric function that describes the proportion of trials with a stop signal in which neural activity exceeded a criterion discharge rate as a function of stop signal delay, to the inhibition function that describes the probability of producing a saccade as a function of stop signal delay. The activity of movement-related but not visual neurons provided the best correspondence between neurometric and inhibition functions. Second, we determined the criterion discharge rate that optimally discriminated between the distributions of discharge rates measured on trials when saccades were produced or withheld. Differential activity of movement-related but not visual neurons could distinguish whether a saccade occurred. The threshold discharge rates determined for individual neurons through these two methods agreed. To investigate how reliably movement-related activity predicted movement initiation; the analyses were carried out with samples of activity from increasing numbers of trials from the same or from different neurons. The reliability of both measures of initiation threshold improved with number of trials and neurons to an asymptote of between 10 and 20 movement-related neurons. Combining the activity of visual neurons did not improve the reliability of predicting saccade initiation. These results demonstrate how the activity of a population of movement-related but not visual neurons in the FEF contributes to the control of saccade initiation. The results also validate these analytical procedures for identifying signals that control saccade initiation in other brain structures.


Figures

Figure 1
Figure 1
Investigating the neural basis of saccade preparation with the countermanding task. A. The race model of countermanding performance. A representative distribution of saccade latencies is illustrated with the characteristic single mode and extended tail. A stop signal presented a particular stop signal delay (SSD) after the target signals the subject to withhold the planned movement. The probabilistic outcome depends on the timing of the stop signal relative to the dynamics of the process that will initiate the saccade. The time needed to cancel the saccade, called stop signal reaction time (SSRT), marks the time when a covert STOP process interrupts preparation of the saccade. Accordingly, SSRT partitions the saccade latency distribution into early values corresponding to non-canceled trials because the saccade was initiated before the STOP process could exert influence and later values corresponding to canceled trials because the saccade was initiated late enough to allow the STOP process to interrupt preparation. B. Eye position for canceled (1) and noncanceled (2) trials. C. Activity of a representative FEF movement neuron in the different types of trials. Saccades are initiated when the activity of these neurons reaches a fixed threshold. If the movement-related activity increases quickly to reach the threshold before the SSRT, a non-canceled trial results (1, thin line). If the activity increases slower so that it would reach the threshold later (2, dashed line), then the STOP process invoked by the stop signal interrupts the growth of activity (thick solid line), preventing it from reaching the threshold so that the saccade is not initiated.
Figure 2
Figure 2
Countermanding task. At the beginning of each trial, monkeys fixate a central spot until it disappears and a peripheral target appears. On most trials monkeys are reinforced for shifting gaze to the target. On less than half of trials at random the fixation spot reappears after a variable stop signal delay. Monkeys are reinforced for canceling the planned saccade to the peripheral target and maintaining fixation. On some trials, though, monkeys shift gaze in error; these non-canceled responses are not reinforced.
Figure 3
Figure 3
Neurometric threshold. A. Saccades are more likely to be canceled if the stop signal appears after a shorter delay (left) than after a longer delay (right) because preparation progresses through time. Thin black line plots activity on trials with no stop signal. Red lines plot activity on trials with a stop signal and the saccade was canceled. One can measure the fraction of trials with and without a stop signal on which discharge rate exceeds some criterion. The fraction of 28 trials that do not exceed a criterion discharge rate decreases as the criterion increases. Three representative criteria are illustrated, very low (1), intermediate (2) and very high (3) (light blue lines). Gray fill indicates duration of SSRT within which the activity is modulated on canceled trials. B. The probability that the build-up activity exceeds a criterion discharge rate is plotted as a function of the criterion for short (thin) and long (thick) stop signal delays. Two trends are clear. First, obviously, the probability of the discharge rate exceeding the criterion decreases as the criterion increases. Second, because presaccadic movement-related activity increases with time, the probability of the discharge rate exceeding the criterion increases with SSD C. Inhibition function (solid points) plots probability of not canceling the saccade as a function of stop signal delay. If saccades are initiated when the activity of movement-related neurons reaches a threshold, then the probability of producing a saccade on a stop signal trial should equal the probability that the activity reaches a threshold. In other words, if a neuron contributes to controlling saccade initiation, then a neurometric function should exist that corresponds to the psychometric inhibition function. Neurometric functions for low (1), intermediate (2) and high (3) criterion discharge rates are plotted. Criterion discharge rates that are too low (1) result in a neurometric function falling above the inhibition function because all discharge rates exceed the criterion. Criterion discharge rates that are too high (3) result in a neurometric function falling below the inhibition function because no discharge rate exceeds the criterion. Criterion discharge rates that are just right (2) result in a neurometric function that increases with stop signal delay paralleling the inhibition function.
Figure 4
Figure 4
Optimal discriminant threshold. Theoretical distributions of maximum activity for canceled (thick solid) and non-canceled (thick dashed) trials. If saccades are initiated when activity exceeds a threshold, then the distribution of activity on non-canceled trials should be greater than that on canceled trials. A criterion discharge rate (vertical line) correctly predicts no saccade for all canceled trials with activity less than the criterion, and it correctly predicts saccade initiation for all non-canceled trials with activity greater than the criterion. However, it incorrectly predicts saccade initiation for canceled trials with activity greater than the criterion, and it incorrectly predicts saccade withholding for non-canceled trials with activity less than the criterion. For each criterion discharge rate, the predictive accuracy can be quantified as the percent of stop signal trials whose outcome is correctly predicted. This percentage is plotted as a function of discharge rate (thin gray line). The optimal discriminant threshold is the maximum of this function.
Figure 5
Figure 5
Activity of a typical movement-related neuron. A. Activity in all trials with no stop signal with the target in the movement field. Activity is shown in rasters for each trial sorted by saccade latency, with saccade initiation time marked by the spot in each raster, and in a plot of the spike density function averaged across the trials. This neuron exhibited a pause in discharging after presentation of the target followed by the characteristic increase of discharge rate before and during saccades. B. Activity in trials with stop signal presented after a particular delay (thick vertical line) and the saccade was canceled. C. Activity in trials with no stop signal with saccade latency equal to or greater than the stop signal delay plus the stop signal reaction time. According to the race model, these trials have latencies long enough that if the stop signal had occurred, the saccade would have been inhibited. These are referred to as latency-matched to the canceled trials. Note the lower peak discharge rate in canceled trials (B) compared to latency-matched no stop signal trials (C). D. Activity in trials with stop signal presented after a particular delay and the saccade was not canceled. E. Activity in trials with no stop signal with saccade latency less than the stop signal delay plus the stop signal reaction time. According to the race model, these trials have latencies short enough that if the stop signal had occurred, the saccade would have initiated anyway. Note that the peak discharge in noncanceled trials (D) is as high as that in latency-matched no stop signal trials (E).
Figure 6
Figure 6
Fitting neurometric and psychometric functions for neuron shown in Figure 5. A. Probability that activation exceeds a criterion discharge rate decreases with criterion. Thin lines plot actual values. Thick lines plot best fit Weibull function. The curves shift to right for progressively longer stop signal delays (distinguished by grayscale as indicated in legend) because the activation of the neuron builds up with time. The vertical cyan line marks the particular criterion discharge rate at which the probability that the activation exceeds that criterion corresponds to the probability that a saccade was initiated at the respective stop signal delays. B. Inhibition function (solid points) measured while the activity of the neuron was recorded and neurometric function (cyan) derived from the criterion discharge rate that minimized the sum-squared difference between the neurometric and psychometric functions. The Pearson correlation between this neurometric function and the inhibition function was 0.9997, and the neurometric threshold was 117 sp/sec. (C) Distribution of Pearson correlation coefficients across the population of movement-related neurons sampled (median r = 0.92).
Figure 7
Figure 7
Computing optimal discriminant threshold for neuron shown in Figure 5. A. Probability density distributions of peak discharge rate in trials with no stop signal (thin black), in noncanceled stop signal trials (dashed black) and in canceled stop signal trials (thick black). Percent of trials correctly classified as canceled or noncanceled is plotted as a function of criterion discharge rate (cyan). Threshold was defined as the criterion discharge rate that maximized the number of canceled trials with activity below the criterion and the number of non-canceled trials with maximum activity above the criterion. For this neuron, a threshold of 76 sp/sec provided the maximal discrimination accuracy of 78% (marked by black arrow). The discriminant accuracy function had a plateau around the maximum, so the true threshold value could lie anywhere within this range. A threshold of 103 sp/sec, which agrees more closely with the neurometric threshold, yielded a predictive accuracy of 77% (marked by gray arrow). B. Distribution of values of percent correctly classified by a particular threshold for the 48 movement-related neurons. The median value was 75% correctly classified trials. C. Histogram of areas under the ROC curve for the 48 FEF movement-related cells, using cancelled vs. non-cancelled trials.
Figure 8
Figure 8
Comparison of neurometric and discriminant thresholds for the sample of FEF neurons with movement-related activity. Data points with perfect agreement between the methods would lie along the diagonal.
Figure 9
Figure 9
Time of threshold crossing in single trials. A. Distribution of the time when activation first exceeded the threshold measured relative to saccade initiation in non-canceled trials. Activation first exceeded the threshold most commonly 20 ms prior to saccade initiation as expected of a neural event that triggered a saccade. B. Distribution of the time when activation first exceeded the threshold measured relative to target presentation in canceled trials. Overall, activation did not exceed the threshold on canceled trials. However, the distributions of maximum activity for canceled and non-canceled trials overlapped slightly, so even with the optimal discriminant threshold, activity on canceled trials sometimes exceeded the threshold even though no saccade was produced. This occasional threshold crossing in single trials occurred at no particular time, though, suggesting that it constitutes measurement noise.
Figure 10
Figure 10
Effect of pooling trials on accuracy of accounting for saccade initiation A. The accuracy of the optimal discriminant threshold at accounting for saccade initiation is plotted as a function of number of trials pooled for each neuron with movement-related activity. Two trends are evident. First, pooling the activity of a neuron across multiple trials increases the accuracy up to an asymptote. Second, the asymptotic accuracy varies across neurons, but most neurons exhibit asymptotic accuracy exceeding 90%. The optimal discriminant threshold for the neuron illustrated in Figure 5 yielded 97% accuracy. B. Distribution of asymptotic accuracy for neurons plotted in A.
Figure 11
Figure 11
Effect of pooling trials across neurons on accuracy of accounting for saccade initiation. Average probability that optimal discriminant threshold correctly accounted for saccade initiation as a function of number of no stop signal trials or stop signal trials pooled across neurons. Error bars plot the standard deviation from 10 random samples. On no stop signal trials (thin line) pooling across six neurons yielded 95% accuracy and 100% accuracy with 10 neurons. On stop signal trials (thick line) the accuracy asymptotically approached 95% accuracy as the pool size approached 50.
Figure 12
Figure 12
Time of threshold crossing of pooled activity. A. Time that pooled spike density functions crossed optimal discriminant threshold for no stop signal (thin) and noncanceled (thick dashed) is plotted as a function of time relative to saccade. The threshold was crossed in 99% of pooled non-canceled trials with a modal value of −21 ms before saccade onset. The threshold was crossed in 100% of pooled no stop signal trials with a modal value of −29 ms before saccade onset. B. Time that pooled spike density functions crossed optimal discriminant threshold for canceled stop signal trials is plotted as a function of time relative to target. The threshold was crossed in 15% of pooled trials with a modal value of 324 ms after target onset which corresponds to the range of saccade latencies. Note the difference in ordinate scale between panels A and B.
Figure 13
Figure 13
Lack of relation of activity of visual neurons in FEF to movement initiation. A. Raster and average spike density of visually responsive neuron aligned on saccade initiation. Trials are sorted by saccade latency. Target presentation time indicated by red dot in raster. The modulation during the saccade is elicited by the visual image swept across the retina by the saccade. B. Frequency distributions of maximum activity on canceled (thick), non-canceled (dotted), and no-stop signal (thin solid) trials. Note that activity is higher on trials without a saccade than on trials with a saccade, because when a saccade occurs, the activity in the interval measured just before movement initiation is less than the visual activity measured after target onset when no saccade occurs. Percent of trials correctly classified as canceled or noncanceled is plotted as a function of criterion discharge rate (cyan). The optimal discriminant threshold for this cell was 196 sp/sec and yielded a predictive accuracy of 51% which was not different from chance.C. Distribution of percent correctly predicted trials for the visual cells. The distribution is not significantly different from chance of 50%. D. Comparison of inhibition function (solid points) and neurometric function derived from the activity of this neuron (cyan). The neurometric and psychometric functions are negatively correlated (R = −0.99), because with longer SSDs, more non-cancelled trials are generated with activity measured immediately prior to saccade initiation. The presaccadic activity is weaker than the visual activity, which is why the cell fails to reliably predict saccade initiation. Thus, for longer SSDs in visual cells, a smaller proportion of trials show measured activity above the threshold . E. Distribution of correlations between neurometric functions from all visual neurons and inhibition functions while those neurons were recorded. A tendency for negative correlations was evident.

References

    1. Aston-Jones G, Cohen JD. An integrative theory of locus coeruleus-norepinephrine function: adaptive gain and optimal performance. Annu Rev Neurosci. 2005;28:403–450. - PubMed
    1. Bichot NP, Thompson KG, Chenchal Rao S, Schall JD. Reliability of macaque frontal eye field neurons signaling saccade targets during visual search. J Neurosci. 2001;21:713–725. - PMC - PubMed
    1. Bogacz R, Brown E, Moehlis J, Holmes P, Cohen JD. The physics of optimal decision making: a formal analysis of models of performance in two-alternative forced-choice tasks. Psychol Rev. 2006;113:700–765. - PubMed
    1. Braitenberg V, Schüz A. Anatomy of the Cortex: Statistics and Geometry. Berlin: Springer-Verlag; 1991.
    1. Britten KH, Shadlen MN, Newsome WT, Movshon JA. The analysis of visual motion: a comparison of neuronal and psychophysical performance. J Neurosci. 1992;12:4745–4765. - PMC - PubMed

Publication types

MeSH terms

LinkOut - more resources