

doi: 10.1021/ja802355u.
Epub 2008 Jul 8.
A targetable fluorescent probe for imaging hydrogen peroxide in the mitochondria of living cells
Affiliations
- PMID: 18605728
- PMCID: PMC2810491
- DOI: 10.1021/ja802355u
Item in Clipboard
A targetable fluorescent probe for imaging hydrogen peroxide in the mitochondria of living cells
J Am Chem Soc.
.
Erratum in
- J Am Chem Soc. 2008 Aug 27;130(34):11561
Abstract
We present the design, synthesis, and biological applications of mitochondria peroxy yellow 1 (MitoPY1), a new type of bifunctional fluorescent probe for imaging hydrogen peroxide levels within the mitochondria of living cells. MitoPY1 combines a chemoselective boronate-based switch and a mitochondrial-targeting phosphonium moiety for detection of hydrogen peroxide localized to cellular mitochondria. Confocal microscopy and flow cytometry experiments in a variety of mammalian cell types show that MitoPY1 can visualize localized changes in mitochondrial hydrogen peroxide concentrations generated by situations of oxidative stress.
Figures
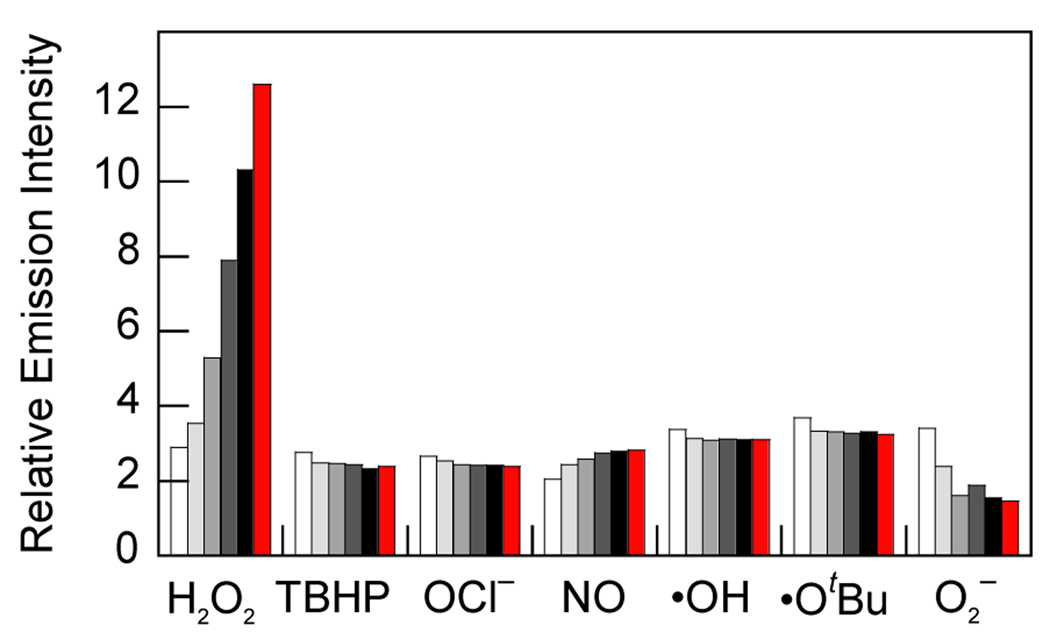
Fluorescence responses of 5 µM MitoPY1 to various reactive oxygen species (ROS). Bars represent relative responses at 0, 5, 15, 30, 45, and 60 min after addition of each ROS. Data shown are for 10 mM O2−, 200 µM NO, and 100 µM for all other ROS. Data were acquired at 25 °C in 20 mM HEPES, pH 7, with excitation λ = 503 nm and emission collected between 510 and 750 nm.
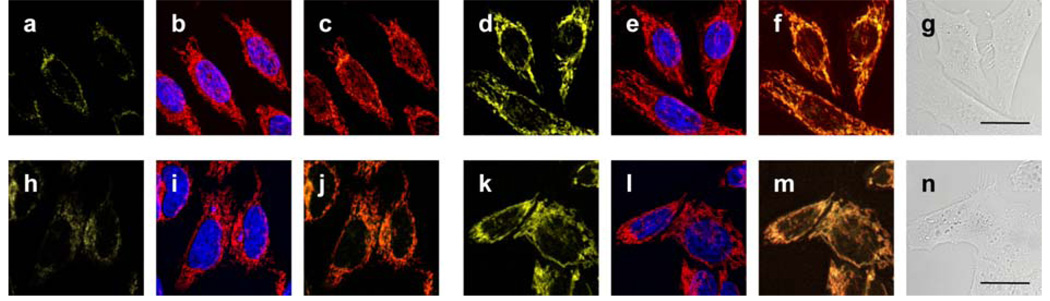
Confocal fluorescence images of live HeLa cells with increases in mitochondrial H2O2 levels visualized using MitoPY1. Images displayed represent emission intensities collected in optical windows between 527–601 nm upon excitation at 510 nm for MitoPY1. HeLa cells incubated with 5 µM MitoPY1 for 60 min at 37 °C and imaged with MitoPY1 (a), MitoTracker Red and Hoechst (overlay, b), and MitoPY1 with MitoTracker Red (overlay, c). HeLa cells incubated with 5 µM MitoPY1 for 60 min at 37 °C with 100 µM H2O2 added for the final 40 min and imaged with MitoPY1 (d), MitoTracker Red and Hoechst (overlay, e), MitoPY1 and MitoTracker Red (overlay, f), and brightfield (g) with 20 µm scale bar. HeLa cells incubated with 5 µM MitoPY1 for 60 min at 37 °C and imaged with MitoPY1 (h), MitoTracker Red and Hoechst (overlay, i), and MitoPY1 with MitoTracker Red (overlay, j). HeLa cells incubated for 24 h with 1 mM paraquat, then washed and incubated with 5 µM MitoPY1 for 60 min at 37 °C and imaged with MitoPY1 (k), MitoTracker Red and Hoechst (overlay, l), MitoPY1 and MitoTracker Red (overlay, m), and brightfield (n) with 20 µm scale bar.
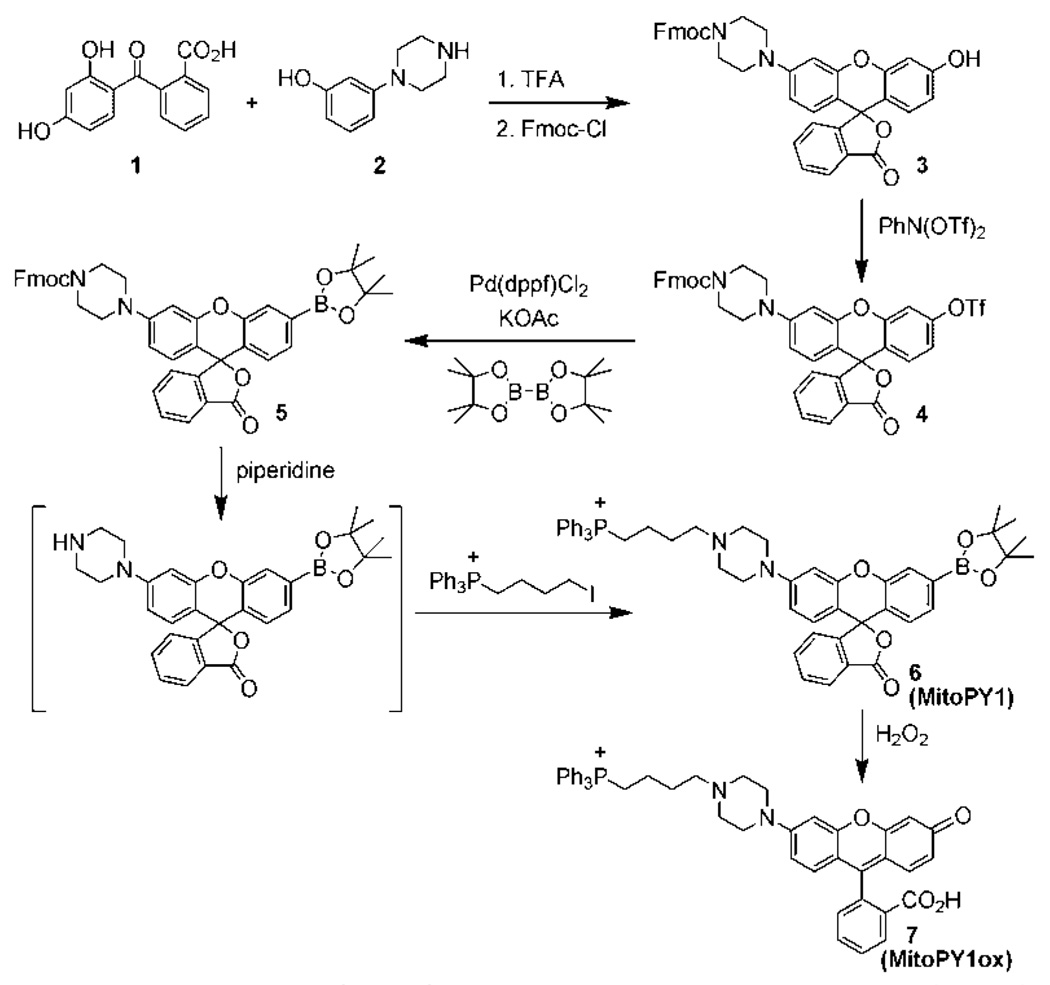
Synthesis and Activation of MitoPY1
References
-
- Rhee SG. Science. 2006;312:1882–1883. - PubMed
-
- Stone JR, Yang S. Antioxid. Redox Signal. 2006;8:243–270. - PubMed
-
- Veal EA, Day AM, Morgan BA. Molecular Cell. 2007;26:1–14. - PubMed
-
- D'Autréaux B, Toledano MB. Nat. Rev. Mol. Cell Biol. 2007;8:813–824. - PubMed
-
- Giorgio M, Trinei M, Migliaccio E, Pelicci PG. Nat. Rev. Mol. Cell Biol. 2007;8:722–728. - PubMed
Publication types
MeSH terms
Substances
Grants and funding
LinkOut - more resources
Full Text Sources
Other Literature Sources
