. 2008 Jul;15(1):163-9.
doi: 10.1016/j.devcel.2008.05.016.

Myosin II activity facilitates microtubule bundling in the neuronal growth cone neck

Affiliations

Myosin II activity facilitates microtubule bundling in the neuronal growth cone neck

Dylan T Burnette et al. Dev Cell. 2008 Jul.

Abstract

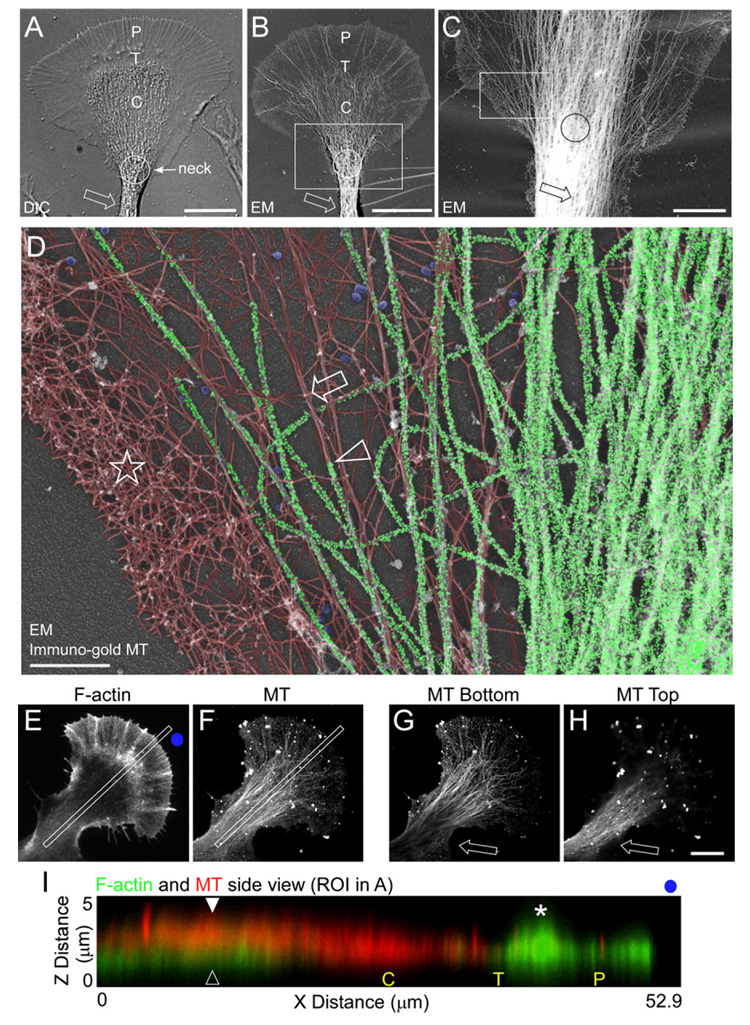
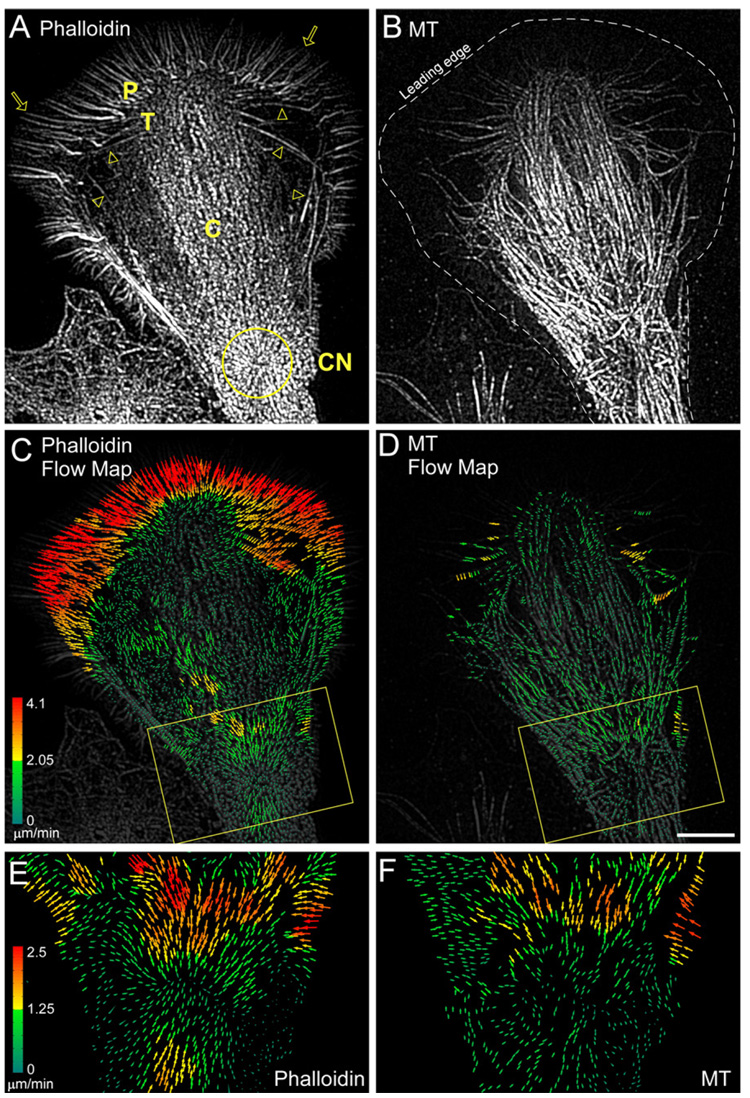
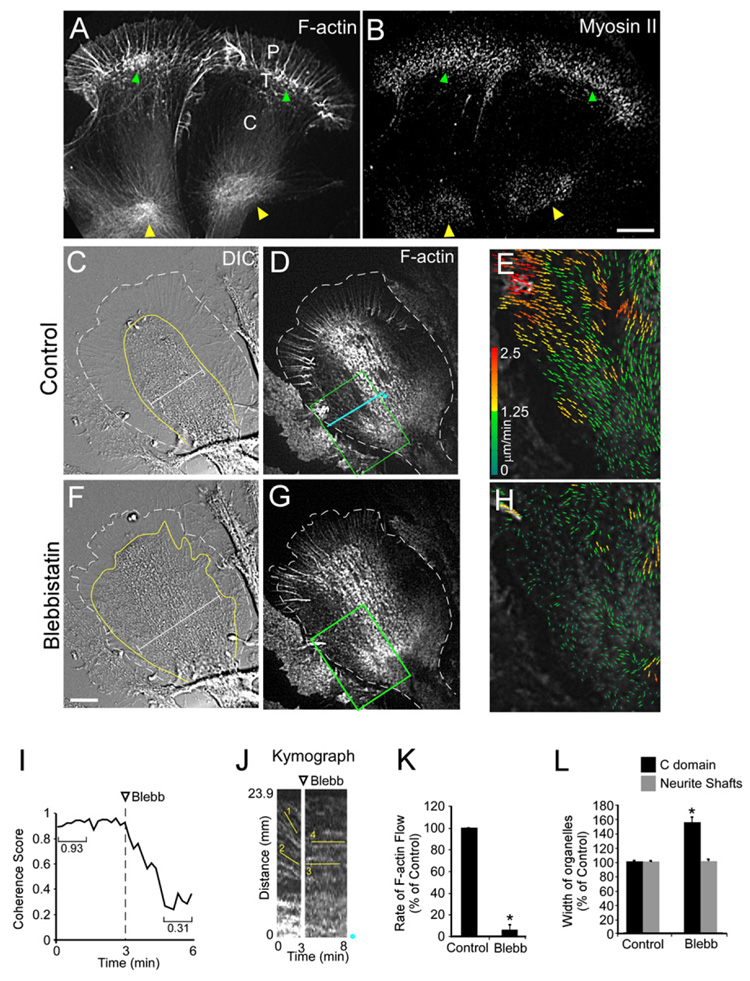
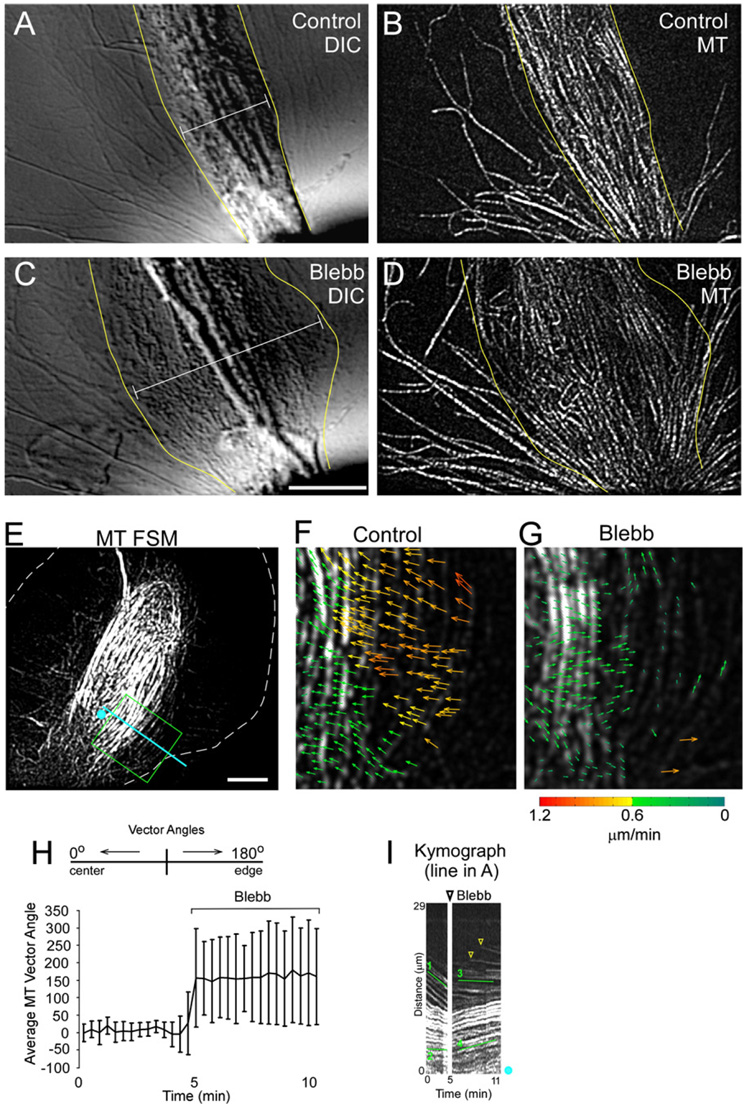
The cell biological processes underlying axon growth and guidance are still not well understood. An outstanding question is how a new segment of the axon shaft is formed in the wake of neuronal growth cone advance. For this to occur, the highly dynamic, splayed-out microtubule (MT) arrays characteristic of the growth cone must be consolidated (bundled together) to form the core of the axon shaft. MT-associated proteins stabilize bundled MTs, but how individual MTs are brought together for initial bundling is unknown. Here, we show that laterally moving actin arcs, which are myosin II-driven contractile structures, interact with growing MTs and transport them from the sides of the growth cone into the central domain. Upon Myosin II inhibition, the movement of actin filaments and MTs immediately stopped and MTs unbundled. Thus, Myosin II-dependent compressive force is necessary for normal MT bundling in the growth cone neck.


Figures

Figure 1
Figure 1. Individual MTs and Actin Filament Bundles Colocalize at the Growth Cone Neck
(A and B) Growth cone structural domains. DIC (A) and low-magnification EM (B) of two separate growth cones. P, T, and C denote peripheral domain, transition zone, and central domain, respectively. Circle denotes growth cone neck and arrow denotes neurite shaft. (C) Gold-labeled MTs of a region similar to box in (B). (D) Higher magnification of the box in (C). Star denotes actin network, arrow denotes an actin bundle, and arrowhead denotes a MT aligned with the actin bundle. Gold particles were individually pseudocolored green to denote MT localization. Actin filaments were pseudocolored red. Gold particle and actin filament labeling was performed with 100% transparency and 22% transparency, respectively, using Canvas X. Clathrin vesicles are pseudocolored blue. (E–H) Spinning disk confocal images of the F-actin and MT cytoskeletons. Full projection z section of the F-actin (E) and MT (F) z sections. Bottom (G) and top (H) view of the MTs. (I) Overlay of the F-actin (green) and MT (red) kymographs taken from the regions of interest in (E) and (F). P, T, and C denote peripheral domain, transition zone, and central domain, respectively. Open arrowhead denotes the actin node and closed arrowhead denotes MTs above the actin node. Star denotes actin “ruffles” in the P domain. Blue dots in (E) and (F) give orientation. Scale bars: (A)–(B) and (E)–(H), 10 µm; (C), 5 µm; (D), 1 µm.
Figure 2
Figure 2. F-Actin and MTs Move Together into the Growth Cone Neck
(A and B) Fluorescent phalloidin (A) and MT (B) FSM in a growth cone. (C and D) Corresponding flow maps for the phalloidin (C) and MT (D) channels. P, T, C, and CN denote peripheral domain, transition zone, central domain, and contractile node (yellow circle), respectively. Yellow boxes denote growth cone base. (E and F) Yellow boxes in (C) and (D), respectively. Colors encode flow speed in µm min−1 and vector arrows, flow direction. Scale bar, 10 µm.
Figure 3
Figure 3. Myosin II Activity Drives Growth Cone Neck Actin Flow
(A and B) F-actin and Myosin II localized in two growth cones after live cell extraction. P domain, T zone, and C domain are labeled. Green arrowheads denote T zone and yellow arrowheads denote the actin node. Note myosin II localization in both regions (arrowheads in [B]). (C–H) Blebbistatin slows actin flow in contractile node. DIC (C) and fluorescent phalloidin FSM (D) of a control growth cone. (E) F-actin FSM flow map of the box in (D). DIC (F) and fluorescent phallodin FSM (G) after 4 min in 70 µM blebbistatin. (H) Flow map of the box in (G). Dotted white lines in (C) and (F) denote leading edge of growth cone. Yellow lines denote the C domain defined by the large organelle boundary, and calipers show the increase in C domain width after blebbistatin treatment. (I) Flow coherence score before and after blebbistatin. The score is calculated by the magnitude of the vector mean of all normalized vectors in a sample box of 25 × 25 pixels (1/N∑Vi/|Vi,|ViVi/, normalized unit vector, N the number of vectors in the box) and calculating the magnitude of the vector mean. If the flow vectors in the box all point to the same direction, the score is 1. Otherwise if their directions are random, it is close to zero. The average score of all sample boxes covering the region of interest is shown. (J) FSM kymograph from the blue line in (D). Blue dots show kymograph orientation. Lines denote flow before (1–2) and after (3–4) blebbistatin treatment. (K) Flow rates slow down by 94.4 ± 4.5%. (L) Organelle domain width in the C domain and neurite shafts before and 5–10 min after blebbistatin treatment (nine growth cones and eight neurite shafts, three measurements each). Width measurements taken perpendicular to the direction of growth cone extension. Scale bars, 10 µm. * p < 0.001.
Figure 4
Figure 4. Myosin II Activity Bundles MTs into the C Domain
(A–D) Result of blebbistatin treatment on MT and organelle distributions. DIC (A) and MT FSM (B) of a control growth cone. DIC (C) and MT FSM (D) after 8 min in 70 µM blebbistatin. Yellow lines denote the C domain and calipers show the increase in width after blebbistatin treatment. (E–G) MTs stop moving into the middle of the neck after blebbistatin treatment. (E) MT FSM of control growth cone. (F and G) Flow map from the box in (E) before (F) and 6 min after (G) blebbistatin treatment. (H) Average vector angles in the middle of the neck before and after blebbistatin. Error bars show standard deviation. (I) MT FSM kymograph from the line in (A). Lines 1 and 2 denote control fast and slow MT flow, respectively. Lines 3 and 4 denote the same regions as 1 and 2, respectively, after blebbistatin treatment. Note the fast MTs on the side stop almost instantaneously (line 3), and the MTs in the C domain start spreading out. Arrowheads denote new MTs passing the kymograph line. Scale bars, 10 µm.

References

    1. Bielas SL, Serneo FF, Chechlacz M, Deerinck TJ, Perkins GA, Allen PB, Ellisman MH, Gleeson JG. Spinophilin facilitates dephosphorylation of doublecortin by PP1 to mediate microtubule bundling at the axonal wrist. Cell. 2007;129:579–591. - PMC - PubMed
    1. Bridgman PC, Kachar B, Reese TS. The structure of cytoplasm in directly frozen cultured cells. II. Cytoplasmic domains associated with organelle movements. J. Cell Biol. 1986;102:1510–1521. - PMC - PubMed
    1. Burmeister JS, Truskey GA, Reichert WM. Quantitative analysis of variable-angle total internal reflection fluorescence microscopy (VA-TIRFM) of cell/substrate contacts. J. Microsc. 1994;173:39–51. - PubMed
    1. Dent EW, Gertler FB. Cytoskeletal dynamics and transport in growth cone motility and axon guidance. Neuron. 2003;40:209–227. - PubMed
    1. Forscher P, Smith SJ. Actions of cytochalasins on the organization of actin filaments and microtubules in a neuronal growth cone. J. Cell Biol. 1988;107:1505–1516. - PMC - PubMed

Publication types

MeSH terms

LinkOut - more resources