. 2008 Jul 15;181(2):1375-85.
doi: 10.4049/jimmunol.181.2.1375.

CD11c expression identifies a population of extrafollicular antigen-specific splenic plasmablasts responsible for CD4 T-independent antibody responses during intracellular bacterial infection

Affiliations

CD11c expression identifies a population of extrafollicular antigen-specific splenic plasmablasts responsible for CD4 T-independent antibody responses during intracellular bacterial infection

Rachael Racine et al. J Immunol. .

Abstract

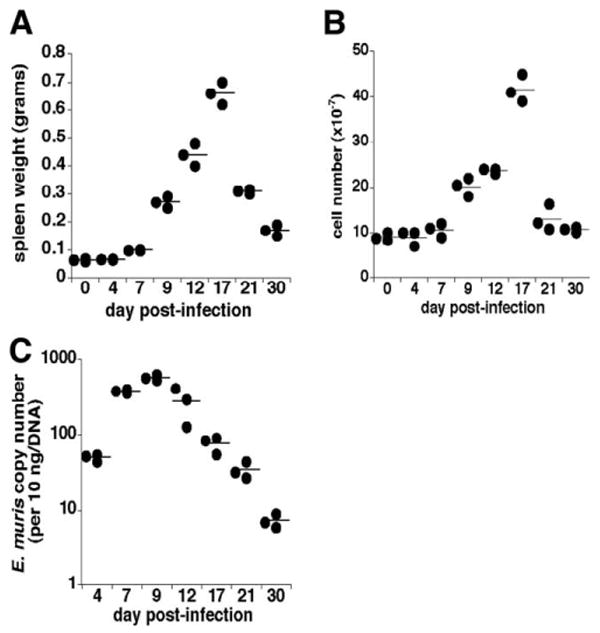
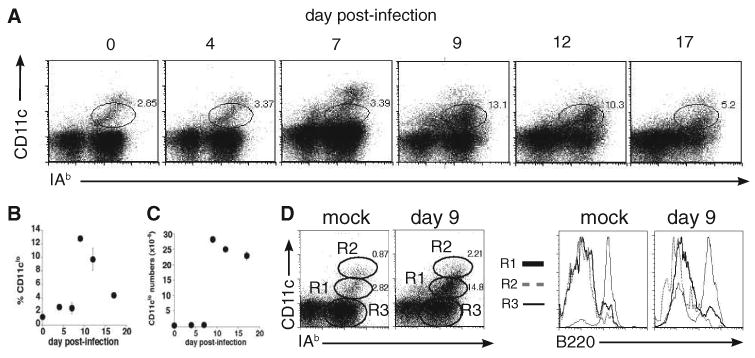
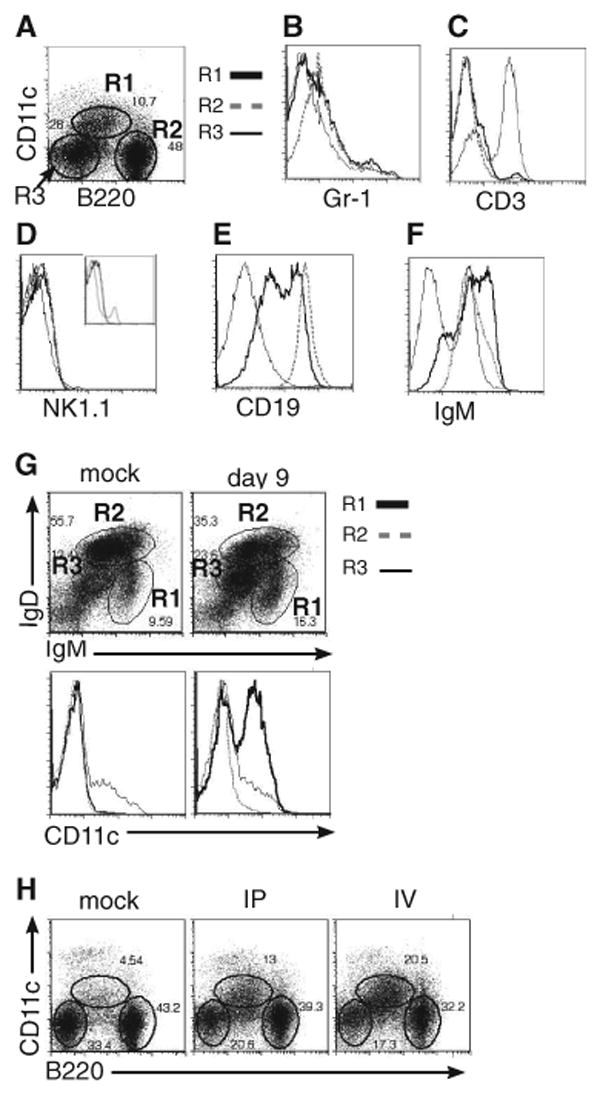
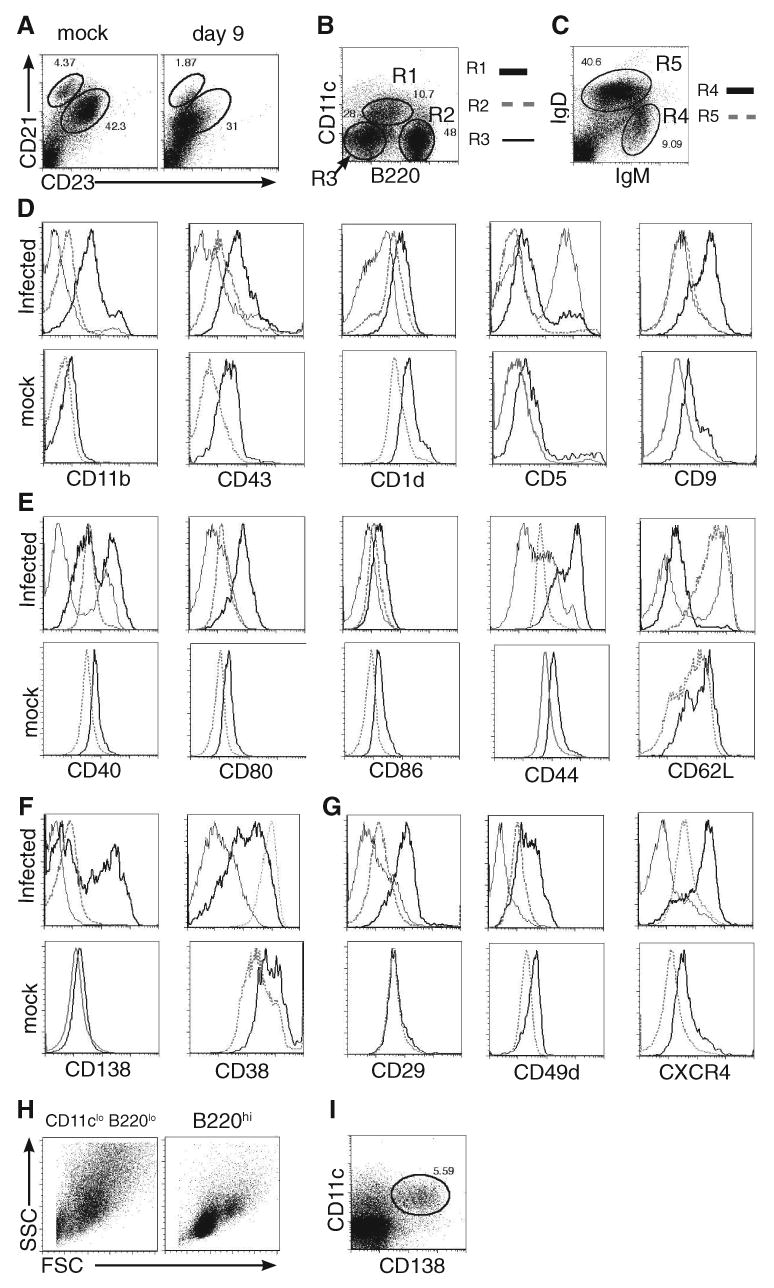
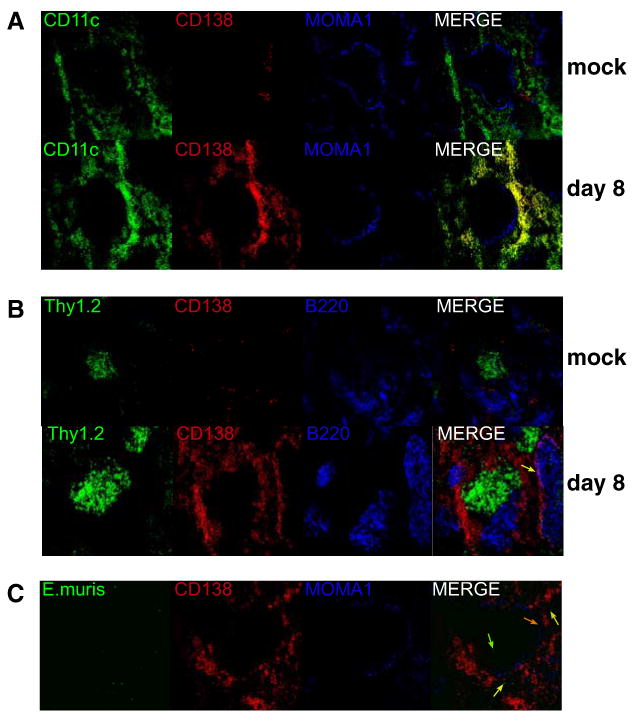
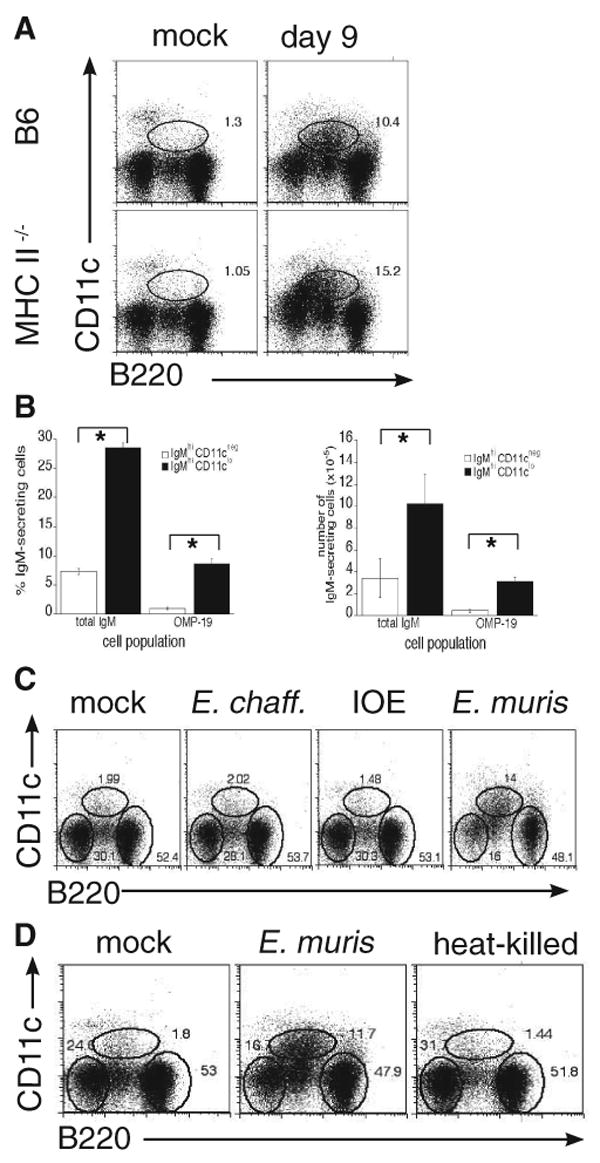
Although T-independent immunity is known to be generated against bacterial capsular and cell wall polysaccharides expressed by a number of bacterial pathogens, it has not been studied in depth during intracellular bacterial infections. Our previous study demonstrated that Ehrlichia muris, an obligate intracellular tick-borne pathogen, generates protective classical TI responses in CD4 T cell-deficient C57BL/6 mice. We found that E. muris T-independent immunity is accompanied by the expansion of a very large extrafollicular spleen population of CD11c(low)-expressing plasmablasts that exhibit characteristics of both B-1 and marginal zone B cells. The plasmablasts comprised up to 15% of the total spleen lymphocytes and approximately 70% of total spleen IgM(high)IgD(low) cells during peak infection in both wild-type and MHC class II-deficient mice. The CD11c(low) cells exhibited low surface expression of B220, CD19, and CD1d, high expression of CD11b, CD43, but did not express CD5. Approximately 50% of the CD11c(low) cells also expressed CD138. In addition to CD11b and CD11c, the plasmablasts expressed the beta(1) (CD29) and alpha4 (CD49d) integrins, as well as the chemokine receptor CXCR4, molecules which may play roles in localizing the B cells extrafollicular region of the spleen. During peak infection, the CD11c(low) cells accounted for the majority of the IgM-producing splenic B cells and nearly all of the E. muris outer membrane protein-specific IgM-secreting cells. Thus, during this intracellular bacterial infection, CD11c expression identifies a population of Ag-specific spleen plasmablasts responsible for T-independent Ab production.


Conflict of interest statement

Disclosures: The authors have no financial conflict of interest.

Figures

Figure 1
Figure 1
Splenomegaly and bacterial infection in E. muris-infected C57BL/6 mice. C57BL/6 mice were infected via the peritoneum with 5 × 10⁴ bacteria and spleen weight (A), mononuclear cellularity (B), and bacterial infection (C) were determined. Individual mice are shown; horizontal lines indicate means. Bacterial copy number was determined by quantitative PCR as described in Materials and Methods.
Figure 2
Figure 2
Detection of a novel CD11c-expressing cell population in spleens of infected mice. Splenocytes from mice infected as described in Fig. 1 were analyzed for expression of CD11c MHC class II IAb and B220. A, A population of CD11clowIAb-positive cells was detected beginning on day 7 postinfection (encircled in the dot plots). B and C, The frequency and number of CD11clow cells detected in A are shown on the indicated days postinfection. D, Flow cytometric gating strategy (left panels) and analysis of B220 (CD45R; right panels) on the cells in the indicated regions are shown. In the day 9-infected mice, the major CD11clow/IAb-positive cell population (R1) exhibited low expression of B220 relative to the CD11cneg IAb population (R3; MFI = 77 ± 2.4 vs 237 ± 8.9, respectively). The R2 population in both the mock- and day 9-infected mice did not express B220.
Figure 3
Figure 3
Flow cytometric characterization of the CD11clow-expressing splenocytes. A, Splenocytes from infected mice (day 9 postinfection) were stained with CD11c and B220, and the indicated populations (R1–R3) were analyzed for expression of Gr-1 (Ly6G; B), CD3 (C), NK1.1 (D), CD19 (E), and IgM (F). CD19 and IgM were the only lineage markers expressed by the B220lowCD11clow population (R1; MFI = 119 ± 12.5 and 107 ± 4.7, respectively). The inset in D shows NK1.1 staining in mock-infected mice. G, IgMhigh (R1) and IgDhigh (R2) populations from mock- and day 9-infected spleens were analyzed for CD11c expression (lower panels). MFI values were determined for the populations from the mock-infected (R1 = 24 ± 8.9; R2 = 17.7 ± 6.9; positive population only) and day 9-infected splenocytes (R1 = 113.0 ± 23.5; R2 = 18.1 ± 2.7). CD19-negative cells were omitted from the analyses. H, The B220lowCD11clow population was monitored on day 9 postinfection following mice infection via the i.v. (IV) or i.p. (IP) routes.
Figure 4
Figure 4
The CD11clow-expressing cells exhibit characteristics of plasmablasts. A, Splenocytes from mock-infected and day 9-infected mice were analyzed for cell surface expression of CD23 and CD21. B, Gating strategy for phenotypic analyses of the day 9-infected mice shown in D. The B220lowCD11clow (R1), B220+CD11c (R2), and B220 CD11c (R3) populations are indicated. C, Regions used for the analysis of IgM+ (R4) and IgD+ (R5) B cell populations from a mock-infected mouse. The cell populations indicated in B and C were analyzed using panels of Abs specific for various B cell subsets (D), cell activation status (E), plasma cell differentiation (F), and integrin and chemokine expression (G). The analysis of the cells from the mock-infected mice was provided as a basis of comparison. Surface staining with isotype-matched control Abs was in all cases within the first decade of the histograms and was omitted for clarity. H, Forward and side scatter analysis of the CD11clowB220low and B220high populations from an infected mice are shown (equivalent to R1 and R2 in B, respectively). I, Expression of CD11c and CD138 on splenocytes from a day 8-infected mouse (encircled).
Figure 5
Figure 5
The CD11clow plasmablasts were located in the extrafollicular region of the spleen. A, Spleen sections from mock-infected controls (top row) and day 8 E. muris-infected mice (bottom row) were stained with the indicated Abs. Double-positive CD11c/CD138 cells can be seen in yellow in the merged image. B, Studies similar to A were performed to define the spatial relationship between the T and B cells and the CD138 plasmablasts. The arrow in the lower right panel indicates double-stained B220/CD138-positive cells. C, Location of E. muris relative to the CD138 plasmablasts. Arrows in the bottom right panel indicate that most bacteria were observed in the extrafollicular region (yellow arrow), but bacteria could also be found in MOMA-1 macrophages (orange arrow) and, on occasion, in the follicle (green arrow).
Figure 6
Figure 6
IgMhighCD11clow cells secrete the majority of IgM and nearly all of the Ag-specific IgM. A, Serum E. muris OMP-19-specific IgM was detected by ELISA at the indicated days postinfection. B, Spleen IgDhighIgMlow and IgDlowIgMhigh cells from E. muris-infected (day 10) and mock-infected control mice were separated by flow cytometric cell sorting. IgDlowIgMhigh cells from infected mice were further separated into the CD11clow and CD11cneg subsets. The frequency and total number of IgM (C)- and OMP-19-specific IgM (D)-secreting cells were determined by ELISPOT. Spots produced by the mock-infected controls (which were negligible) were subtracted from the corresponding populations obtained from the infected mice. Data are representative of four independent experiments. E, Kinetic analysis of the splenic IgM- and OMP-specific IgM-secreting cells. ELISPOTs were performed as in C, except that T cell depletion was performed instead of flow cytometric cell sorting. The differences between the CD11clow and CD11cneg populations in C and D were statistically significant (p < 0.001, indicated by the brackets), as determined using the unpaired Student's t test). Error bars, SDs.
Figure 7
Figure 7
CD11clow B cells are elicited in the absence of CD4 T cells and only under conditions to generate protective immunity. A, C57BL/6 control mice (top row) and MHC class II-deficient mice (bottom row) were analyzed for B220 and CD11c cell surface expression on day 9 postinfection. B, Spleen CD11clow and CD11chigh IgDlowIgMhigh cells from MHC class II-deficient E. muris-infected (day 9) and mock-infected control mice were separated by flow cytometric cell sorting, as described in Fig. 6. The frequency (left panel) and total number (right panel) of IgM- and OMP-19-specific IgM-secreting cells were determined by ELISPOT analysis. C, Splenocytes from C57BL/6 mice infected with E. chaffeensis or IOE were analyzed for B220 and CD11c expression on day 9 postinfection and were compared with E. muris-infected control mice. Each group contained three mice and the frequencies of CD11clowB220low cells in each group were as follows: mock infected (1.9 ± 0.4%), E. chaffeensis infected (2.83 ± 1.9%), and IOE infected (1.77 ± 1.8%); a single E. muris-infected mouse was used in the experiment. D, Mice were infected with E. muris or heat-killed E. muris and the frequency of the B220lowCD11clow population was determined on day 9 postinfection. Each group contained three mice and the frequencies of CD11clowB220low cells in each group were as follows: mock infected (1.8 ± 0.3%), E. muris infected (12.1 ± 2.8%), and heat-killed E. muris infected (2.8 ± 0.9%).

References

    1. Martin F, Kearney JF. B1 cells: similarities and differences with other B cell subsets. Curr Opin Immunol. 2001;13:195–201. - PubMed
    1. Mond JJ, Lees A, Snapper CM. T cell-independent antigens type 2. Annu Rev Immunol. 1995;13:655–692. - PubMed
    1. Martin F, Oliver AM, Kearney JF. Marginal zone and B1 B cells unite in the early response against T-independent blood-borne particulate antigens. Immunity. 2001;14:617–629. - PubMed
    1. Vos Q, Lees A, Wu ZQ, Snapper CM, Mond JJ. B-cell activation by T-cell-independent type 2 antigens as an integral part of the humoral immune response to pathogenic microorganisms. Immunol Rev. 2000;176:154–170. - PubMed
    1. Jacob J, Kassir R, Kelsoe G. In situ studies of the primary immune response to (4-hydroxy-3-nitrophenyl)acetyl: I. The architecture and dynamics of responding cell populations. J Exp Med. 1991;173:1165–1175. - PMC - PubMed

Publication types

MeSH terms