Invasion suppressor cystatin E/M (CST6): high-level cell type-specific expression in normal brain and epigenetic silencing in gliomas
- PMID: 18607344
- PMCID: PMC2574902
- DOI: 10.1038/labinvest.2008.66
Invasion suppressor cystatin E/M (CST6): high-level cell type-specific expression in normal brain and epigenetic silencing in gliomas
Abstract
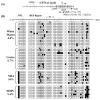
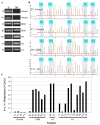
DNA hypermethylation-mediated gene silencing is a frequent and early contributor to aberrant cell growth and invasion in cancer. Malignant gliomas are the most common primary brain tumors in adults and the second most common tumor in children. Morbidity and mortality are high in glioma patients because tumors are resistant to treatment and are highly invasive into surrounding brain tissue rendering complete surgical resection impossible. Invasiveness is regulated by the interplay between secreted proteases (eg, cathepsins) and their endogenous inhibitors (cystatins). In our previous studies we identified cystatin E/M (CST6) as a frequent target of epigenetic silencing in glioma. Cystatin E/M is a potent inhibitor of cathepsin B, which is frequently overexpressed in glioma. Here, we study the expression of cystatin E/M in normal brain and show that it is highly and moderately expressed in oligodendrocytes and astrocytes, respectively, but not in neurons. Consistent with this, the CST6 promoter is hypomethylated in all normal samples using methylation-specific PCR, bisulfite genomic sequencing, and pyrosequencing. In contrast, 78% of 28 primary brain tumors demonstrated reduced/absent cystatin E/M expression using a tissue microarray and this reduced expression correlated with CST6 promoter hypermethylation. Interestingly, CST6 was expressed in neural stem cells (NSC) and markedly induced upon differentiation, whereas a glioma tumor initiating cell (TIC) line was completely blocked for CST6 expression by promoter methylation. Analysis of primary pediatric brain tumor-derived lines also showed CST6 downregulation and methylation in nearly 100% of 12 cases. Finally, ectopic expression of cystatin E/M in glioma lines reduced cell motility and invasion. These results demonstrate that epigenetic silencing of CST6 is frequent in adult and pediatric brain tumors and occurs in TICs, which are thought to give rise to the tumor. CST6 methylation may therefore represent a novel prognostic marker and therapeutic target specifically altered in TICs.
Figures


Similar articles
-
Methylation-dependent silencing of CST6 in primary human breast tumors and metastatic lesions.Exp Mol Pathol. 2007 Oct;83(2):188-97. doi: 10.1016/j.yexmp.2007.03.008. Epub 2007 Apr 18. Exp Mol Pathol. 2007. PMID: 17540367 Free PMC article.
-
Epigenetic silencing of the tumor suppressor cystatin M occurs during breast cancer progression.Cancer Res. 2006 Aug 15;66(16):7899-909. doi: 10.1158/0008-5472.CAN-06-0576. Cancer Res. 2006. PMID: 16912163
-
DNA methylation-dependent silencing of CST6 in human breast cancer cell lines.Lab Invest. 2006 Dec;86(12):1233-42. doi: 10.1038/labinvest.3700485. Epub 2006 Oct 16. Lab Invest. 2006. PMID: 17043665
-
Epigenetic regulation of cystatins in cancer.Front Biosci (Landmark Ed). 2009 Jan 1;14(2):453-62. doi: 10.2741/3254. Front Biosci (Landmark Ed). 2009. PMID: 19273077 Review.
-
Epigenetic aberrations and therapeutic implications in gliomas.Cancer Sci. 2010 Jun;101(6):1331-6. doi: 10.1111/j.1349-7006.2010.01545.x. Epub 2010 Mar 15. Cancer Sci. 2010. PMID: 20384628 Free PMC article. Review.
Cited by
-
Investigation of the clinical significance and prospective molecular mechanisms of cystatin genes in patients with hepatitis B virus‑related hepatocellular carcinoma.Oncol Rep. 2019 Jul;42(1):189-201. doi: 10.3892/or.2019.7154. Epub 2019 May 9. Oncol Rep. 2019. PMID: 31115549 Free PMC article.
-
The role of stem cells in tumor targeting and growth suppression of gliomas.Biologics. 2011;5:61-70. doi: 10.2147/BTT.S17838. Epub 2011 Apr 5. Biologics. 2011. PMID: 21637731 Free PMC article.
-
A Pan-Cancer Analysis of Cystatin E/M Reveals Its Dual Functional Effects and Positive Regulation of Epithelial Cell in Human Tumors.Front Genet. 2021 Sep 17;12:733211. doi: 10.3389/fgene.2021.733211. eCollection 2021. Front Genet. 2021. PMID: 34603393 Free PMC article.
-
Modulation of Dnmt3b function in vitro by interactions with Dnmt3L, Dnmt3a and Dnmt3b splice variants.Nucleic Acids Res. 2011 Jul;39(12):4984-5002. doi: 10.1093/nar/gkr116. Epub 2011 Mar 4. Nucleic Acids Res. 2011. PMID: 21378119 Free PMC article.
-
Identification of candidate tumour suppressor genes frequently methylated in renal cell carcinoma.Oncogene. 2010 Apr 8;29(14):2104-17. doi: 10.1038/onc.2009.493. Epub 2010 Feb 15. Oncogene. 2010. PMID: 20154727 Free PMC article.
References
-
- Li E. Chromatin modification and epigenetic reprogramming in mammalian development. Nature Rev Genet. 2002;3:662–673. - PubMed
-
- Baylin SB, Esteller M, Rountree MR, et al. Aberrant patterns of DNA methylation, chromatin formation and gene expression in cancer. Hum Mol Genet. 2001;10(7):687–692. - PubMed
-
- Chen RZ, Pettersson U, Beard C, et al. DNA hypomethylation leads to elevated mutation rates. Nature. 1998;395:89–93. - PubMed
-
- Eden A, Gaudet F, Waghmare A, et al. Chromosomal instability and tumors promoted by DNA hypomethylation. Science. 2003;300:455. - PubMed
-
- Jones PA, Baylin SB. The fundamental role of epigenetic events in cancer. Nature Rev Genet. 2002;3:415–428. - PubMed
Publication types
MeSH terms
Substances
Grants and funding
LinkOut - more resources
Full Text Sources
Medical
Research Materials
Miscellaneous

