. 2008 Jul 7;14(25):4020-7.
doi: 10.3748/wjg.14.4020.

Is the pain in chronic pancreatitis of neuropathic origin? Support from EEG studies during experimental pain

Affiliations

Is the pain in chronic pancreatitis of neuropathic origin? Support from EEG studies during experimental pain

Asbjørn M Drewes et al. World J Gastroenterol. .

Abstract

Aim: To prove the hypothesis that patients with chronic pancreatitis would show increased theta activity during painful visceral stimulation.

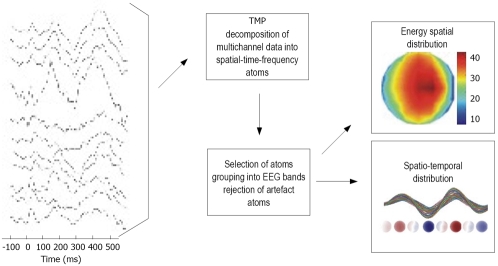
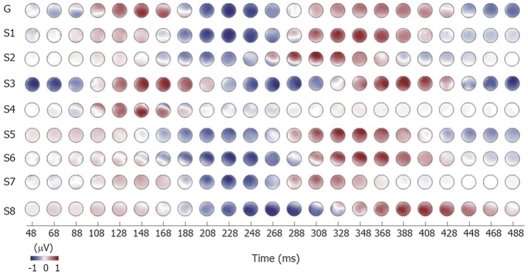
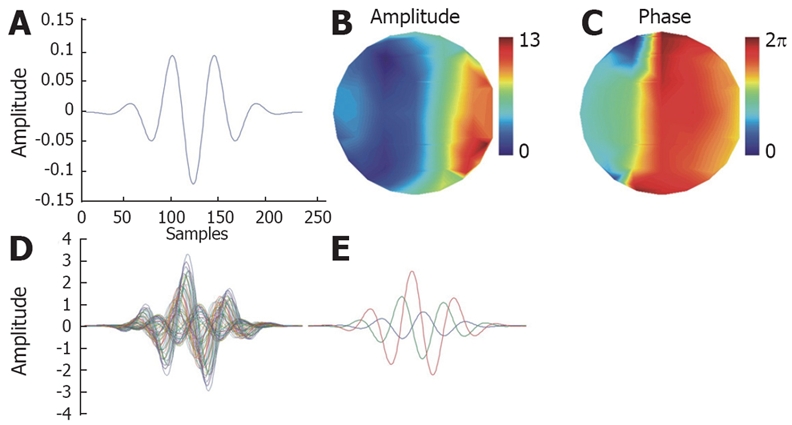
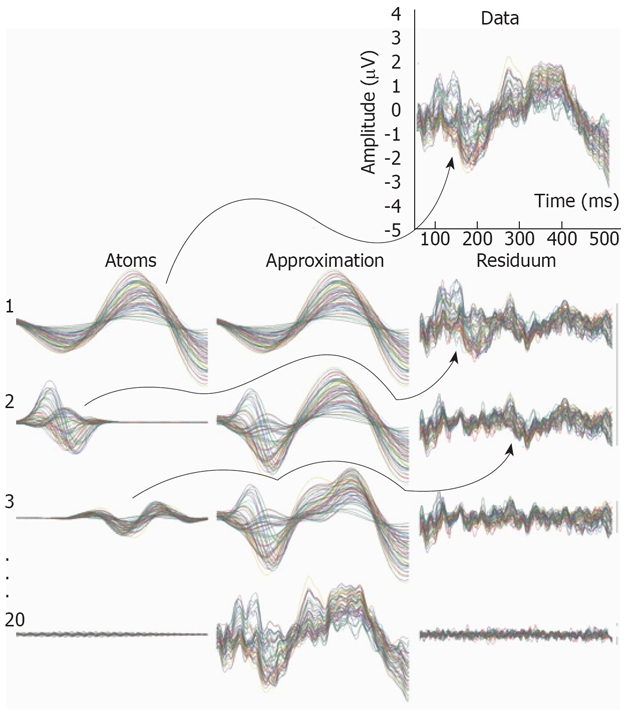
Methods: Eight patients and 12 healthy controls underwent an experiment where the esophagus was electrically stimulated at the pain threshold using a nasal endoscope. The electroencephalogram (EEG) was recorded from 64 surface electrodes and "topographic matching pursuit" was used to extract the EEG information in the early brain activation after stimulation.

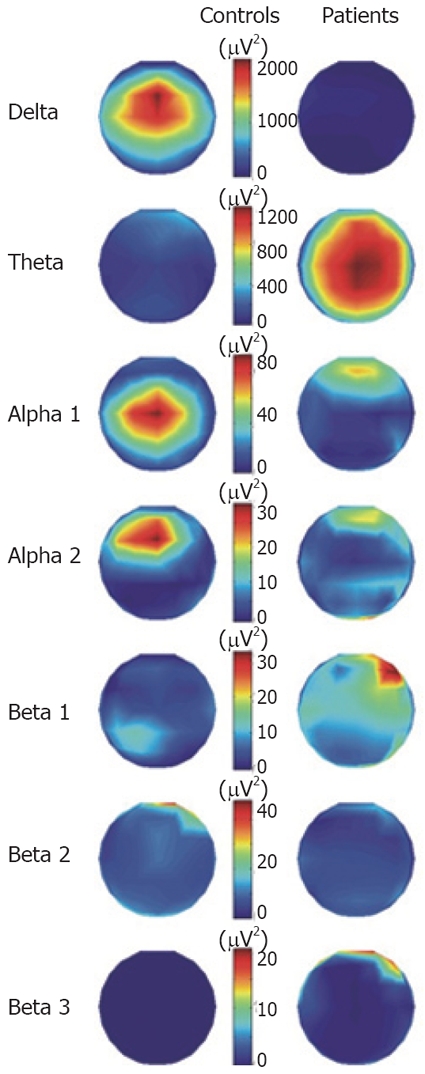
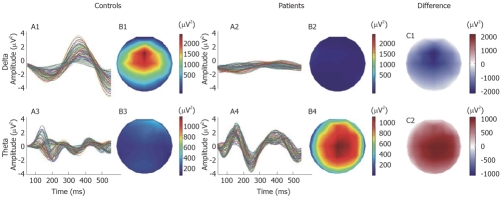
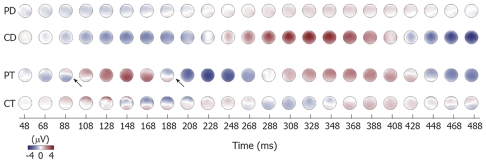
Results: A major difference between controls and patients were seen in delta and theta bands, whereas there were only minor differences in other frequency bands. In the theta band, the patients showed higher activity than controls persisting throughout the 450 ms of analysis with synchronous brain activation between the channels. The main theta components oscillated with 4.4 Hz in the patients and 5.5 Hz in the controls. The energy in the delta (0.5-3.5 Hz) band was higher in the controls, whereas the patients only showed scattered activity in this band.

Conclusion: The differences in the theta band indicate that neuropathic pain mechanisms are involved in chronic pancreatitis. This has important implications for the understanding and treatment of pain in these patients, which should be directed against drugs with effects on neuropathic pain disorders.


Figures

Figure 1
Figure 1
The analysis scheme used for the data investigation. The EEG data were decomposed into a set of TMP atoms, which parameterized the data. Next, the atoms were grouped into bands according to their frequency parameter. This allowed convenient analysis of time and spatial properties of oscillations in all frequency bands.
Figure 2
Figure 2
The spatial distribution of energy divided into frequency bands for patients and controls throughout the 450 ms of analysis. Note that a different color scaling for each frequency band was used.
Figure 3
Figure 3
The temporal evolution and the spatial distribution maps of energy of the delta and theta activities for the 450 ms of analysis. In the right panel, the difference maps of energy were computed by subtracting the energy maps of controls from the patients.
Figure 4
Figure 4
The time evolution of amplitude distribution for delta and theta bands in patients and controls. Note the stable, monopolar spatial distribution of delta activity in controls (CD). This is due to constant and small phase differences between measurement channels. The theta activity in patients has slight changes in phase and, therefore, the spatial distribution is not always stable (see arrows). PD: Patients delta; PT: Patients theta; CD: Controls delta; CT: Controls theta.
Figure 5
Figure 5
Normalized time evolution of amplitude distributions for theta bands in patients with chronic pancreatitis No. 1-8. G: Grand mean of all patients.
Figure Appendix1
Figure Appendix1
Example of a TMP atom for a 61 channel EEG system. A: Base Gabor atom; B: Spatial distribution of amplitude; C: Spatial distribution of phase; Overlay plots of the TMP atom: All 61 channels (D), channels 1, 10 and 30 (E).
Figure Appendix2
Figure Appendix2
Example of decomposition of multichannel EEG data. The data is presented in the top-right corner (61 channels overlay plot). In the following rows chosen atoms, approximations and residues for the 1st, 2nd, 3rd, and 20th iteration are shown. In each iteration the chosen atom is the most similar one with the previously computed residuum (see arrows). The residuum is created by subtracting the chosen atom from the residuum computed in the previous iteration. The signal itself can be treated as the 0th order residuum. The approximation in each iteration is the sum of all atoms chosen in the present and previous iterations. Hence, in the first iteration the chosen atom is simultaneously the first approximation of the data. Note that with the increasing number of iterations the approximation is approaching the data and the residuum is vanishing. All time plots of atoms, approximations and residues are 61-channel overlay plots shown in the same scale.

References

    1. Andren-Sandberg A, Viste A, Horn A, Hoem D, Gislason H. Pain management of pancreatic cancer. Ann Oncol. 1999;10 Suppl 4:265–268. - PubMed
    1. Di Sebastiano P, di Mola FF, Bockman DE, Friess H, Bochler MW. Chronic pancreatitis: the perspective of pain generation by neuroimmune interaction. Gut. 2003;52:907–911. - PMC - PubMed
    1. Friess H, Shrikhande S, Shrikhande M, Martignoni M, Kulli C, Zimmermann A, Kappeler A, Ramesh H, Bochler M. Neural alterations in surgical stage chronic pancreatitis are independent of the underlying aetiology. Gut. 2002;50:682–686. - PMC - PubMed
    1. Di Sebastiano P, di Mola FF, Di Febbo C, Baccante G, Porreca E, Innocenti P, Friess H, Bochler MW. Expression of interleukin 8 (IL-8) and substance P in human chronic pancreatitis. Gut. 2000;47:423–428. - PMC - PubMed
    1. Shrikhande SV, Friess H, di Mola FF, Tempia-Caliera A, Conejo Garcia JR, Zhu Z, Zimmermann A, Bochler MW. NK-1 receptor gene expression is related to pain in chronic pancreatitis. Pain. 2001;91:209–217. - PubMed

Publication types