Novel DNA microarray system for analysis of nascent mRNAs
- PMID: 18611946
- PMCID: PMC2575885
- DOI: 10.1093/dnares/dsn015
Novel DNA microarray system for analysis of nascent mRNAs
Abstract
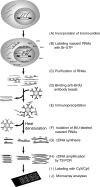
Transcriptional activation and repression are a key step in the regulation of all cellular activities. The development of comprehensive analysis methods such as DNA microarray has advanced our understanding of the correlation between the regulation of transcription and that of cellular mechanisms. However, DNA microarray analysis based on steady-state mRNA (total mRNA) does not always correspond to transcriptional activation or repression. To comprehend these transcriptional regulations, the detection of nascent RNAs is more informative. Although the nuclear run-on assay can detect nascent RNAs, it has not been fully applied to DNA microarray analysis. In this study, we have developed a highly efficient method for isolating bromouridine-labeled nascent RNAs that can be successfully applied to DNA microarray analysis. This method can linearly amplify small amounts of mRNAs with little bias. Furthermore, we have applied this method to DNA microarray analysis from mouse G2-arrested cells and have identified several genes that exhibit novel expression profiles. This method will provide important information in the field of transcriptome analysis of various cellular processes.
Figures


Similar articles
-
Hypoxic transcription gene profiles under the modulation of nitric oxide in nuclear run on-microarray and proteomics.BMC Genomics. 2009 Sep 2;10:408. doi: 10.1186/1471-2164-10-408. BMC Genomics. 2009. PMID: 19725949 Free PMC article.
-
Gene expression profiling of whole blood: comparison of target preparation methods for accurate and reproducible microarray analysis.BMC Genomics. 2009 Jan 5;10:2. doi: 10.1186/1471-2164-10-2. BMC Genomics. 2009. PMID: 19123946 Free PMC article.
-
Microarray profiling of lung long non-coding RNAs and mRNAs in lipopolysaccharide-induced acute lung injury mouse model.Biosci Rep. 2019 Apr 30;39(4):BSR20181634. doi: 10.1042/BSR20181634. Print 2019 Apr 30. Biosci Rep. 2019. PMID: 30979832 Free PMC article.
-
Genome-wide analysis of mRNA polysomal profiles with spotted DNA microarrays.Methods Enzymol. 2007;431:177-201. doi: 10.1016/S0076-6879(07)31010-0. Methods Enzymol. 2007. PMID: 17923236 Review.
-
Novel developments for improved detection of specific mRNAs by DNA chips.Appl Microbiol Biotechnol. 2008 Oct;80(6):953-63. doi: 10.1007/s00253-008-1680-2. Epub 2008 Sep 11. Appl Microbiol Biotechnol. 2008. PMID: 18784921 Review.
Cited by
-
Genome-wide technology for determining RNA stability in mammalian cells: historical perspective and recent advantages based on modified nucleotide labeling.RNA Biol. 2012 Oct;9(10):1233-8. doi: 10.4161/rna.22036. Epub 2012 Oct 1. RNA Biol. 2012. PMID: 23034600 Free PMC article. Review.
-
Quantification of nascent transcription by bromouridine immunocapture nuclear run-on RT-qPCR.Nat Protoc. 2015 Aug;10(8):1198-211. doi: 10.1038/nprot.2015.076. Epub 2015 Jul 16. Nat Protoc. 2015. PMID: 26182239 Free PMC article.
-
Global analysis of RNA metabolism using bio-orthogonal labeling coupled with next-generation RNA sequencing.Methods. 2019 Feb 15;155:88-103. doi: 10.1016/j.ymeth.2018.12.001. Epub 2018 Dec 6. Methods. 2019. PMID: 30529548 Free PMC article. Review.
-
Coordinated regulation of synthesis and stability of RNA during the acute TNF-induced proinflammatory response.Proc Natl Acad Sci U S A. 2013 Feb 5;110(6):2240-5. doi: 10.1073/pnas.1219192110. Epub 2013 Jan 23. Proc Natl Acad Sci U S A. 2013. PMID: 23345452 Free PMC article.
-
Direct evidence for postmeiotic transcription during Drosophila melanogaster spermatogenesis.Genetics. 2010 Sep;186(1):431-3. doi: 10.1534/genetics.110.118919. Epub 2010 Jul 6. Genetics. 2010. PMID: 20610406 Free PMC article.
References
-
- Gunji W., Kai T., Sameshima E., et al. Global analysis of the expression patterns of transcriptional regulatory factors in formation of embryoid bodies using sensitive oligonucleotide microarray systems. Biochem. Biophys. Res. Commun. 2004;325:265–275. - PubMed
-
- Garcia-Martinez J., Aranda A., Perez-Ortin J. E. Genomic run-on evaluates transcription rates for all yeast genes and identifies gene regulatory mechanisms. Mol. Cell. 2004;15:303–313. - PubMed
Publication types
MeSH terms
Substances
LinkOut - more resources
Full Text Sources
Molecular Biology Databases

