. 2008 Oct;74(4):972-9.
doi: 10.1124/mol.108.048512. Epub 2008 Jul 8.

Differential activation and trafficking of micro-opioid receptors in brain slices

Affiliations

Differential activation and trafficking of micro-opioid receptors in brain slices

Seksiri Arttamangkul et al. Mol Pharmacol. 2008 Oct.

Abstract

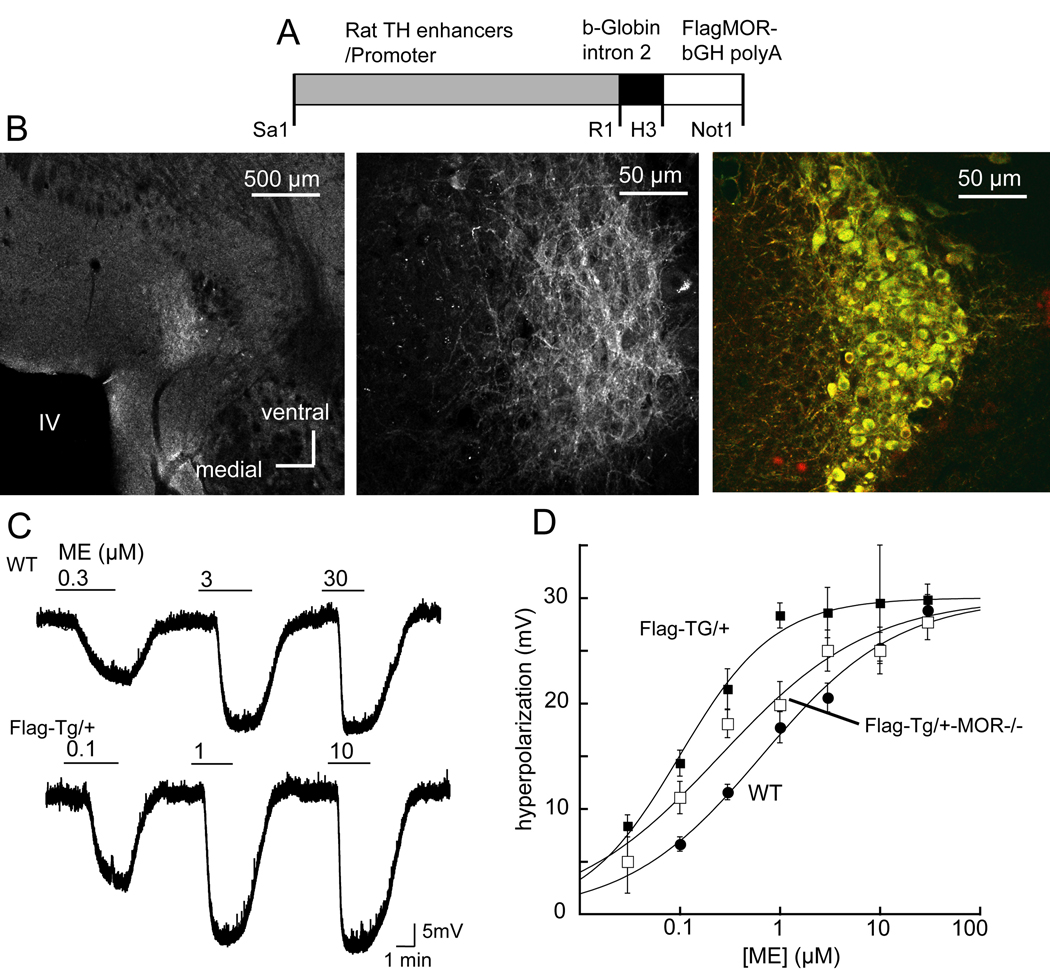
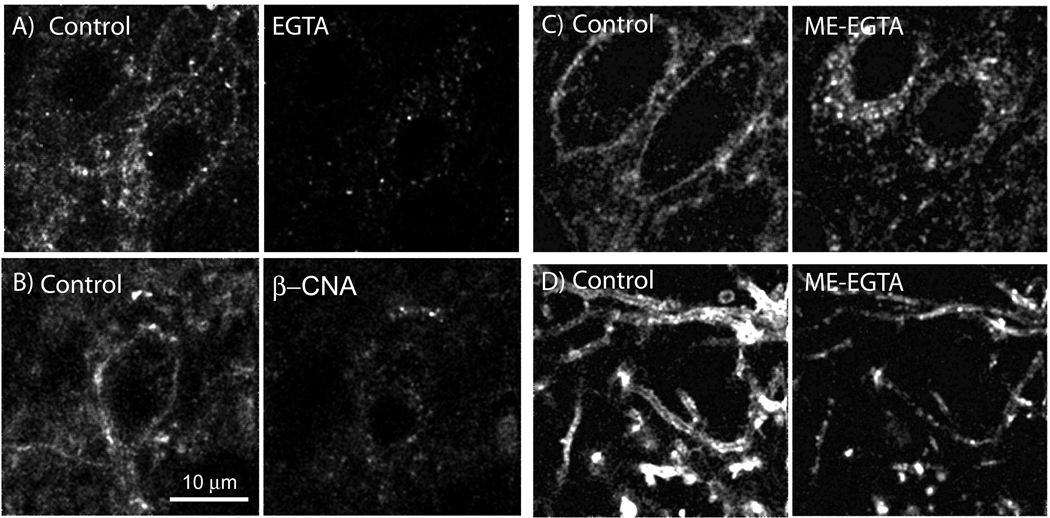
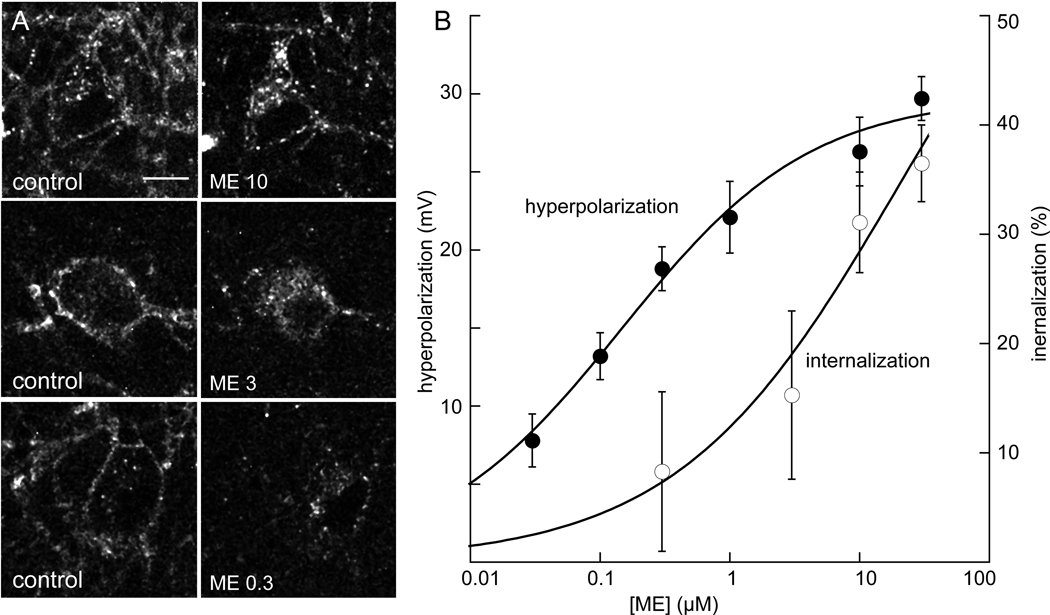
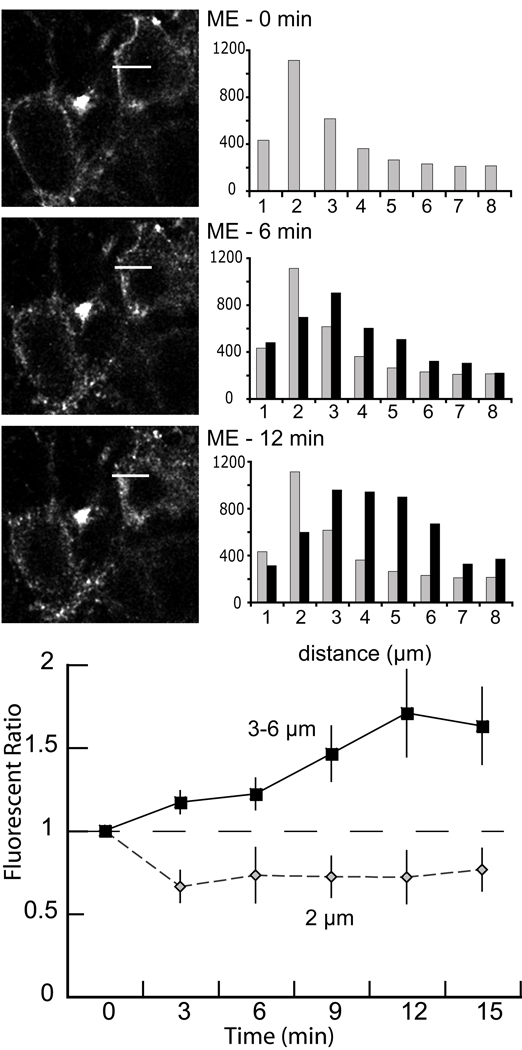
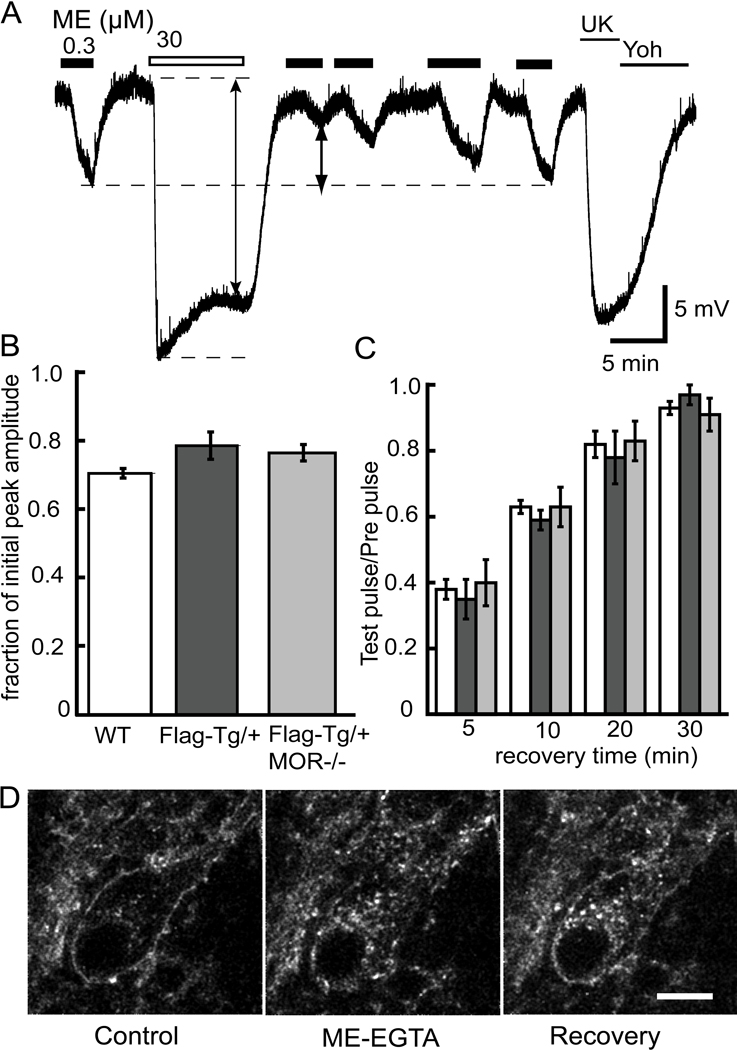
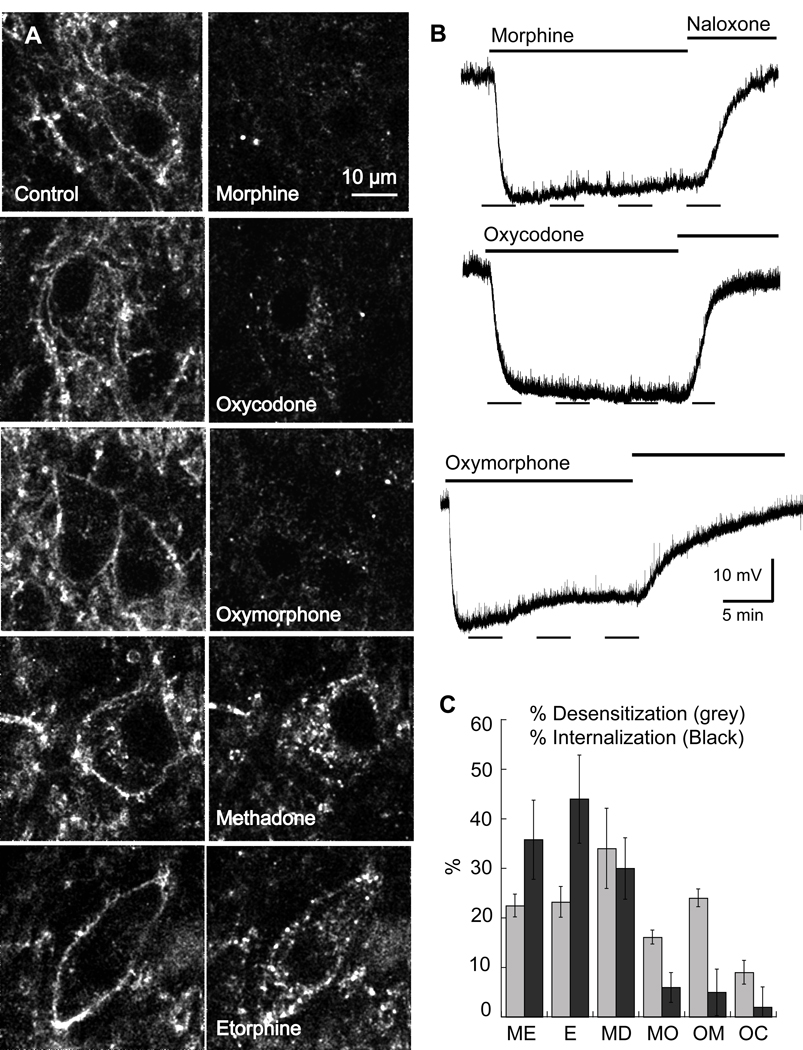
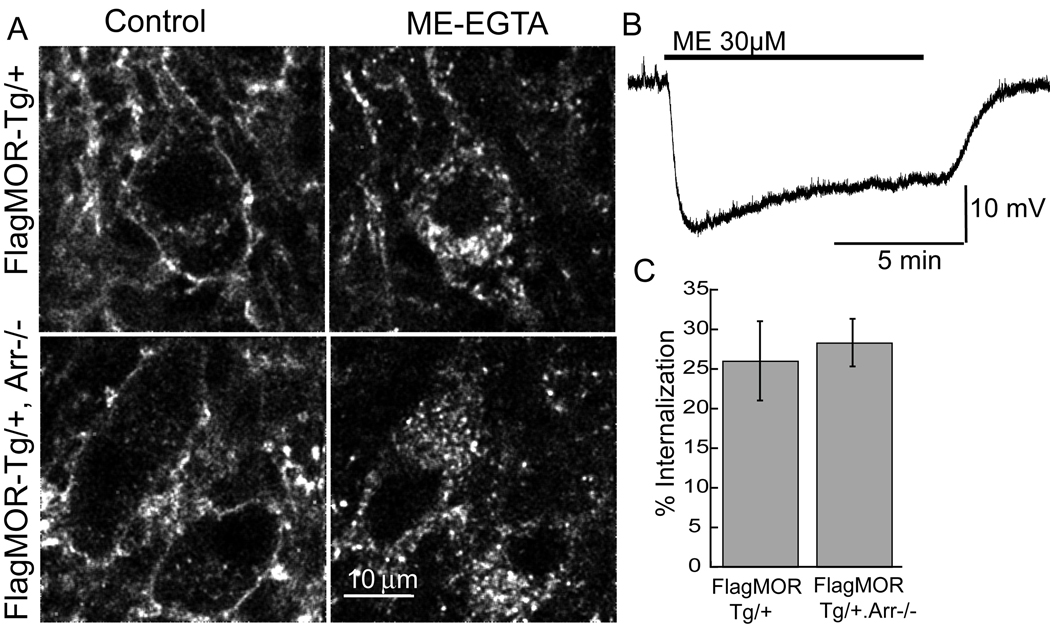
The activation of G protein-coupled receptors results in a cascade of events that include acute signaling, desensitization, and internalization, and it is thought that not all agonists affect each process to the same extent. The early steps in opioid receptor signaling, including desensitization, have been characterized electrophysiologically using brain slice preparations, whereas most previous studies of opioid receptor trafficking have been conducted in heterologous cell models. This study used transgenic mice that express an epitope-tagged (FLAG) micro-opioid receptor (FLAGMOR) targeted to catecholamine neurons by regulatory elements from the tyrosine hydroxylase gene. Brain slices from these mice were used to study tagged MOR receptors in neurons of the locus ceruleus. Activation of the FLAGMOR with [Met5]enkephalin (ME) produced a hyperpolarization that desensitized acutely to the same extent as native MOR in slices from wild-type mice. A series of opioid agonists were then used to study desensitization and receptor trafficking in brain slices, which was monitored with a monoclonal antibody against the FLAG epitope (M1) conjugated to Alexa 594. Three patterns of receptor trafficking and desensitization were observed: 1) ME, etorphine, and methadone resulted in both receptor desensitization and internalization; 2) morphine and oxymorphone caused significant desensitization without evidence for internalization; and 3) oxycodone was ineffective in both processes. These results show that two distinct forms of signaling were differentially engaged depending on the agonist used to activate the receptor, and they support the hypothesis that ligand-specific regulation of opioid receptors occurs in neurons maintained in brain slices from adult animals.


Figures

Figure 1
Figure 1
Expression and signaling of FlagMOR in locus coeruleus (LC) neurons. A) Restriction map of the tyrosine hydroxylase (TH)-FlagMOR-Tg construct. B) Left, low power micrograph of a slice containing the LC. The light area is the LC stained using the M1 antibody conjugated with Alexa 555. Middle, higher power image showing fluorescent staining of processes and cell bodies. Right, FlagMOR was stained in red and TH was stained with a secondary antibody labeled with Alexa488. C. [Met]5enkephalin (ME) caused a concentration dependent hyperpolarization in slices from wild type and FlagMOR-Tg/+ mice. Cells from the FlagMOR-Tg/+ mice were more sensitive to ME. D. Concentration-response curves for ME in slices from wild type (solid circles, EC50=653 nM), FlagMOR-Tg/+ (filled squares, EC50=94 nM) and compound mutant FlagMOR-Tg/+, MOR−/− mice (open squares, EC50=151 nM).
Figure 2
Figure 2
Internalization of FlagMORs induced by ME is receptor dependent. A) Control (left) shows the initial staining pattern with an Alexa 594-conjugated anti-Flag antibody. Right, same slice after treatment with calcium-free (EGTA) solution. C&D) Internalization of FlagMOR induced by ME. Left, initial staining illustrating cell bodies (C) and dendrites (D). Right, staining following treatment of the slice with ME (30 µM, 15 min) followed by calcium-free (EGTA, 10 min) solution. B) Pretreatment with β-CNA (500 nM, 2 min) blocked internalization induced by ME. Left is control and the right side after ME (30 µM, 15 min).
Figure 3
Figure 3
The concentration dependence of internalization induced by ME. A) Images were taken in control (left side) and after treatment of slices with different concentrations of ME for 15 min followed by a wash with calcium free solution (right side). B) Internalization required high concentrations of ME. The percent internalization caused by a 15-minute application of ME is plotted and compared with the concentration response to the hyperpolarization. All experiments were carried out using slices from FlagMOR-TG/+,MOR−/− animals.
Figure 4
Figure 4
The time course of receptor internalization. A) An illustration of a single experiment showing the time course of internalization with images collected at 6 min intervals (top before ME, middle 6 min after ME, bottom 12 min after ME). Each image is a single Z-scan (1 µm). The white bar in each image represented the area used to determine fluorescent intensity from the plot profile (0.5 × 8 µm, ImageJ). The fluorescence measured over a distance of 1 µm was added and plotted at the right for each image. Grey bars are the fluorescence measured before addition of ME. At 6 and 12 min the fluorescence moved away from the plasma membrane into the interior of the cell. B) Summary of the fluorescent ratio increasing in cytoplasm during 15 min perfusion of ME (30 µM, n=4). The fluorescence ratio was determined by dividing the counts measured after the addition of ME by the counts in the same area before addition of ME. Fluorescence decreased at the plasma membrane (2 µm, grey diamonds) and increased in the interior of the cell (3–6 µm, solid squares).
Figure 5
Figure 5
Recovery from desensitization and reinsertion of FlagMOR into plasma membrane. A) Voltage trace from a wild type mouse showing the hyperpolarization induced by ME (300 nM) before and after treatment of the slice with ME (30 µM) for 10 min. Following the washout of ME (30 µM) the hyperpolarization induced by ME (300 nM) was depressed and recovered completely after 30 min. At the end of the recording a saturating concentration of UK14304 (3 µM), an alpha-2-adrenoceptor agonist, and its blockade by the antagonist yohimbine (Yoh), was tested. B. Summary of the change in membrane potential during the 10-min treatment with ME (30 µM). The results indicate that the decline in the hyperpolarization was the same in slices from all three genotypes. C. Summary of the time course and extent of recovery from desensitization. There was no difference between genotypes. Given that the FlagMOR-Tg/+ and FlagMOR-Tg/+ MOR−/− were more sensitive to ME, the test concentration used to measure the recovery from desensitization was reduced to 100 nM. D) Return of receptors to the plasma membrane of cell bodies. Left panels are the initial staining. Middle taken after application of ME (30µM, 5 min) and EGTA solution (10 min). Right taken after a 45 min wash.
Figure 6
Figure 6
Agonist-selective internalization. A) Images of the internalization. Left, control; right, after agonist (15 min) followed by calcium-free (EGTA) wash. Etorphine (E) and methadone (MD) caused dramatic internalization, while morphine (MO), oxymorphone (OM) and oxycodone (OC) caused very little. B) Example traces of the hyperpolarization induced by morphine, oxycodone and oxymorphone (15 µM each) all agonists that caused little or no internalization. C) Summary plot showing the decline in hyperpolarization (% desensitization, gray bars) and internalization (% internalization, black bars). The results show that different opioids produce different patterns of receptor regulation. [Met]5enkephalin, ME.
Figure 7
Figure 7
[Met]5enkephalin (ME) induced MOR internalization occurs in absence of β-arrestin2. A. Image from FlagMOR-Tg/+ (top) and FlagMOR-Tg/+, Arr−/− LC slices in control (left) and following application of ME (30µM, 15 min) and calcium-free (EGTA) solution (right). Intracellular puncta were observed in both genotypes. B. Intracellular recording of the hyperpolarization produced by application of ME (30 µM). The response declines to approximately 76% of the initial amplitude during the 10 min application. C. Summary of the percent internalization caused by ME in FlagMOR-Tg/+, Arr−/− and their FlagMOR-Tg/+ littermates.

Similar articles

Cited by

References

    1. Alvarez VA, Arttamangkul S, Dan V, Salem A, Whistler J, von Zastrow M, Grandy D, Williams JT. μ-opioid receptors: ligand dependent activation of potassium conductance, desensitization and internalization. J. Neurosci. 2002;22:5769–5776. - PMC - PubMed
    1. Arttamangkul S, Torrecilla M, Kobayashi K, Okano H, Williams JT. Separation of mu-opioid receptor desensitization and internalization: endogenous receptors in primary neuronal cultures. J Neurosci. 2006;26:4118–4125. - PMC - PubMed
    1. Bohn LM, Gainetdinov RR, Lin FT, Lefkowitz RJ, Caron MG. Mu-opioid receptor desensitization by beta-arrestin-2 determines morphine tolerance but not dependence. Nature. 2000;408(6813):720–723. - PubMed
    1. Bohn LM, Dykstra LA, Lefkowitz RJ, Caron MG, Barak LS. Relative opioid efficacy is determined by the complements of the G protein-coupled receptor desensitization machinery. Mol Pharmacol. 2004;66:106–112. - PubMed
    1. Borgland SL, Connor M, Osborne PB, Furness JB, Christie MJ. Opioid agonists have different efficacy profiles for G protein activation, rapid desensitization, and endocytosis of mu-opioid receptors. J Biol Chem. 2003;278:18776–18784. - PubMed

Publication types

MeSH terms

LinkOut - more resources