. 2008 Jul 9;3(7):e2648.
doi: 10.1371/journal.pone.0002648.

Functional analysis of spontaneous cell movement under different physiological conditions

Affiliations

Functional analysis of spontaneous cell movement under different physiological conditions

Hiroaki Takagi et al. PLoS One. .

Abstract

Cells can show not only spontaneous movement but also tactic responses to environmental signals. Since the former can be regarded as the basis to realize the latter, playing essential roles in various cellular functions, it is important to investigate spontaneous movement quantitatively at different physiological conditions in relation to a cell's physiological functions. For that purpose, we observed a series of spontaneous movements by Dictyostelium cells at different developmental periods by using a single cell tracking system. Using statistical analysis of these traced data, we found that cells showed complex dynamics with anomalous diffusion and that their velocity distribution had power-law tails in all conditions. Furthermore, as development proceeded, average velocity and persistency of the movement increased and as too did the exponential behavior in the velocity distribution. Based on these results, we succeeded in applying a generalized Langevin model to the experimental data. With this model, we discuss the relation of spontaneous cell movement to cellular physiological function and its relevance to behavioral strategies for cell survival.


Conflict of interest statement

Competing Interests: The authors have declared that no competing interests exist.

Figures

Figure 1
Figure 1. Dictyostelium cell in the vegetative and starved state, along with the corresponding cellular trajectories.
(a) and (c) are vegetative, (b) and (d) are starved (for 5.5 hr). Scale bar is 10 µm. In each case, we plot the trajectories of 20 cells for 40 minutes. All original cell positions are set to the axis origin. As development proceeds, cell polarity also develops.
Figure 2
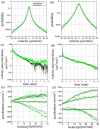
Figure 2. Analyzed motile properties of Dictyostelium cells for all the experimental conditions.
(a),(b): Mean square displacement (MSD) and its logarithmic derivatives are shown in a log-log plot and semi-log plot, respectively. (c): Velocity distribution for the×axis is shown in a semi-log plot. Velocity per second was calculated and shown in minutes. (d): Dependence of the kurtosis of the x-axis component displacement distribution on time. (e): Autocorrelation function of velocity. (f): Dependence of the average turn angle on time. (g): Dependence of the average turn rate on velocity. In each developmental period, cellular tracks for 40 minutes were sampled over 100 cells to calculate all the above quantities. Standard errors are plotted together in (a),(e),(f),(g) (most error bars are smaller than the symbols).
Figure 3
Figure 3. Velocity distribution, autocorrelation and dependence of mean and standard deviation (SD) of acceleration on velocity.
(a),(b): (a) Velocity distribution for the x-axis and (b) velocity autocorrelation of vegetative and starved cells (5.5 hr) are shown in a log-log plot. Exponential (two exponential in (b)) and Gaussian fitting curves are plotted together. Power-law lines are guides for the reader. (c),(d): Dependence of mean and standard deviation (SD) of acceleration on velocity. Parallel and perpendicular components to the moving direction are calculated. (c) vegetative cells, (d) starved cells (5.5 hr).
Figure 4
Figure 4. Simulation results corresponding to vegetative and starved cells.
Simulated velocity distribution ((a),(b)), velocity autocorrelation ((c),(d)) and dependence of mean and standard deviation of acceleration on velocity in parallel and perpendicular components to the moving direction ((e),(f)) in the case of vegetative and starved cells (5.5 hr). Corresponding experimental results are plotted together.

References

    1. Bray D. Cell movements: from molecules to motility. New York: Garland publishing; 2000.
    1. Ueda M, Sako Y, Tanaka T, Devreotes P, Yanagida T. Single-molecule analysis of chemotactic signaling in Dictyostelium cells. Science. 2001;294:864–867. - PubMed
    1. Sato MJ, Ueda M, Takagi H, Watanabe TM, Yanagida T, Ueda M. Input-output relationship in galvanotactic response of Dictyostelium cells. Biosystems. 2007;88:261–272. - PubMed
    1. Shenderov AD, Sheetz MP. Inversely correlated cycles in speed and turning in an ameba: an oscillatory model of cell locomotion. Biophys J. 1997;72:2382–2389. - PMC - PubMed
    1. Dormann D, Weijer CJ. Chemotactic cell movement during Dictyostelium development and gastrulation. Curr Opin Genet Dev. 2006;16:367–373. - PubMed

Publication types