. 2008 May;45(2):303-22.
doi: 10.1353/dem.0.0006.

The gradient in sub-Saharan Africa: socioeconomic status and HIV/AIDS

Affiliations

The gradient in sub-Saharan Africa: socioeconomic status and HIV/AIDS

Jane G Fortson. Demography. 2008 May.

Abstract

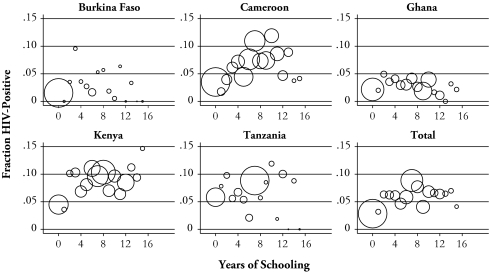
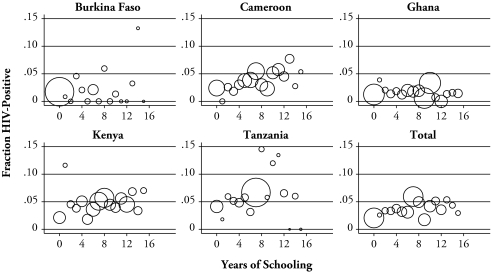
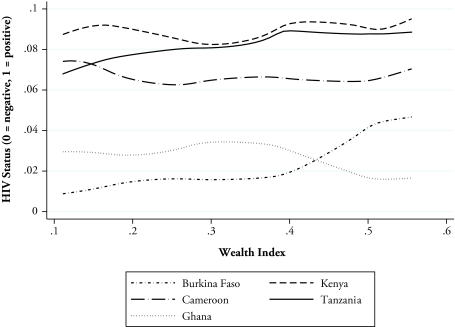
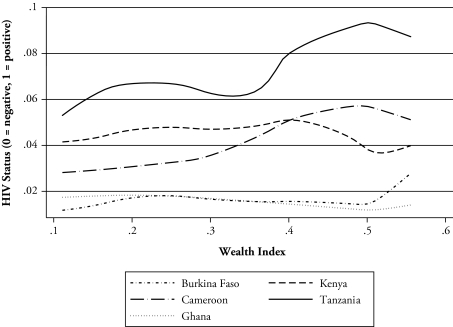
Using data from the Demographic and Health Surveys (DHS) for Burkina Faso (2003), Cameroon (2004), Ghana (2003), Kenya (2003), and Tanzania (2003), I investigate the cross-sectional relationship between HIV status and socioeconomic status. I find evidence of a robust positive education gradient in HIV infection, showing that, up to very high levels of education, better-educated respondents are more likely to be HIV-positive. Adults with six years of schooling are as much as three percentage points more likely to be infected with HIV than adults with no schooling. This gradient is not an artifact of age, sector of residence, or region of residence. With controls for sex, age, sector of residence, and region of residence, adults with six years of schooling are as much as 50% more likely to be infected with HIV than those with no schooling. Education is positively related to certain risk factors for HIV including the likelihood of having premarital sex. Estimates of the wealth gradient in HIV, by contrast, vary substantially across countries and are sensitive to the choice of measure of wealth.


Figures

Figure 1.
Figure 1.
Education Gradient in HIV Infection: Women Source: DHS for Burkina Faso (2003), Cameroon (2004), Ghana (2003), Kenya (2003), and Tanzania (2003). Notes: The sample includes women ages 15–49 who were tested for HIV. The figure shows the fraction of women who tested positive for HIV at each educational level between 0 and 16 years. The size of the circle indicates the number of women at that educational level who were tested for HIV, weighted using provided HIV sample weights.
Figure 2.
Figure 2.
Education Gradient in HIV Infection: Men Source: DHS for Burkina Faso (2003), Cameroon (2004), Ghana (2003), Kenya (2003), and Tanzania (2003). Notes: The sample includes men ages 15–59 (Burkina Faso, Cameroon, and Ghana), 15–54 (Kenya), and 15–49 (Tanzania) who were tested for HIV. The figure shows the fraction of men who tested positive for HIV at each educational level between 0 and 16 years. The size of the circle indicates the number of men at that educational level who were tested for HIV, weighted using provided HIV sample weights.
Figure 3.
Figure 3.
Wealth Gradient in HIV Infection: Women Source: DHS for Burkina Faso (2003), Cameroon (2004), Ghana (2003), Kenya (2003), and Tanzania (2003). Notes: The sample includes women ages 15–49 who were tested for HIV. The wealth index is the fraction of nine assets or amenities that the respondent’s household has; the assets and amenities are radio, television, refrigerator, bicycle, motorcycle, car, telephone, electricity, and a flush toilet or pit latrine (must have nonmissing values for at least five components to be included). Results are from Fan locally weighted regressions with a biweight quartic kernel with a halfwidth of 0.35, and are weighted using provided HIV sample weights.
Figure 4.
Figure 4.
Wealth Gradient in HIV Infection: Men Source: DHS for Burkina Faso (2003), Cameroon (2004), Ghana (2003), Kenya (2003), and Tanzania (2003). Notes: The sample includes men ages 15–59 (Burkina Faso, Cameroon, and Ghana), 15–54 (Kenya), and 15–49 (Tanzania) who were tested for HIV. The wealth index is the fraction of nine assets or amenities that the respondent’s household has; the assets and amenities are radio, television, refrigerator, bicycle, motorcycle, car, telephone, electricity, and a flush toilet or pit latrine (must have nonmissing values for at least five components to be included). Results are from Fan locally weighted regressions with a biweight quartic kernel with a halfwidth of 0.35, and are weighted using provided HIV sample weights.

References

    1. Auvert B, Taljaard D, Lagarde E, Sobngwi-Tambekou J, Sitta R, Puren A. “Randomized, Controlled Intervention Trial of Male Circumcision for Reduction of HIV Infection Risk: The ANRS 1265 Trial”. PLoS Medicine. 2005;2:e298. - PMC - PubMed
    1. Case A, Lubotsky D, Paxson C. “Economic Status and Health in Childhood: The Origins of the Gradient”. American Economic Review. 2002;92:1308–34. - PubMed
    1. Case A, Paxson C, Ableidinger J. “Orphans in Africa: Parental Death, Poverty and School Enrollment”. Demography. 2004;41:483–508. - PubMed
    1. Daly MC, Duncan GJ, McDonough P, Williams DR. “Optimal Indicators of Socioeconomic Status for Health Research”. American Journal of Public Health. 2002;92:1151–57. - PMC - PubMed
    1. de Walque D. World Bank; Washington, DC: 2002. “How Does the Impact of an HIV/AIDS Information Campaign Vary with Educational Attainment? Evidence From Rural Uganda”. World Bank Policy Research Working Paper 3289.

LinkOut - more resources