. 2008 Apr;5(2):277-98.
doi: 10.3934/mbe.2008.5.277.

The role of feedback in the formation of morphogen territories

Affiliations

The role of feedback in the formation of morphogen territories

David Iron et al. Math Biosci Eng. 2008 Apr.

Abstract

In this paper, we consider a mathematical model for the formation of spatial morphogen territories of two key morphogens: Wingless (Wg) and Decapentaplegic (DPP), involved in leg development of Drosophila. We define a gene regulatory network (GRN) that utilizes autoactivation and cros-sinhibition (modeled by Hill equations) to establish and maintain stable boundaries of gene expression. By computational analysis we find that in the presence of a general activator, neither autoactivation, nor cross-inhibition alone are sufficient to maintain stable sharp boundaries of morphogen production in the leg disc. The minimal requirements for a self-organizing system are a coupled system of two morphogens in which the autoactivation and cross-inhibition have Hill coefficients strictly greater than one. In addition, the GRN modeled here describes the regenerative responses to genetic manipulations of positional identity in the leg disc.


Figures

Fig. 1
Fig. 1
(a–b) leg imaginal discs with anterior to the left and dorsal up. (a) schematic picture of a leg imaginal disc; (b) production of both bmp/dpp (green) and wg (red). The line indicates the x-axis of the proposed model.
Fig. 2
Fig. 2
Sample graphs of the functions Act and Inh with m = 4, u0=12, Kmax = 1 and Kmin = 0.
Fig. 3
Fig. 3
Approximation of the heteroclinic connection for (17). For this simulation, I = 0.0099805992, m = 2, Kmax = 0.051, Kmin = 0.001. For these values, w ~= 0.0000950097 and w+ ~ 0.0075233436.
Fig. 4
Fig. 4
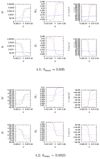
Numerical simulation of full system with parameter values Kmin = 0.0001 m = n = 3. In both runs the final time is t = 150000 seconds. The plots of w signal and b signal are plots of the production rates of w and b respectively.
Fig. 5
Fig. 5
A numerical simulation of system (1) with m = 1, n = 3, Kmin = 0.001 and Kmax = 0.01. The final time step is at t = 100 seconds.
Fig. 6
Fig. 6
A continuation of the simulation given in Figure 5 with a much larger time-step in order to display the convergence to an equilibrium. The final time step is at t = 5000 seconds.
Fig. 7
Fig. 7
A numerical simulation of system (1) for m = 3, n = 3 and cross-inhibition of Br on W shut off. The values of Kmax and Kmin are adjusted to produce maximum and minimum production rates of 0.012 and 0.0012 respectively for all terms. Final time step is at t = 300 seconds.
Fig. 8
Fig. 8
A continuation of the simulation given in Figure 7 with a much larger time-step in order to display the convergence to an equilibrium. Final time step is at t = 5000 seconds.
Fig. 9
Fig. 9
A numerical simulation of system (1) for m = 3, n = 3 and auto-activation of W shut off. The values of Kmax and Kmin are adjusted to produce maximum and minimum production rates of 0.012 and 0.0012 respectively for all terms. Final time step is at t = 300 seconds.
Fig. 10
Fig. 10
A continuation of the simulation given in Figure 9 with a much larger time-step in order to display the convergence to an equilibrium. Final time step is at t = 5000 seconds.
Fig. 11
Fig. 11
In this simulation there are no Wg receptors for 0.012 < x < 0.016 . The final time step is at t = 15000 seconds. The slight localized increase in W is due to lack of receptor to bind with. The localized increase in B is due to the local lack of inhibition.
Fig. 12
Fig. 12
Simulation of region with defective Wg receptors in the region 0.013 < x < 0.018. Since Wg is still able to bind to its receptor there is no localized increase as seen in Figure 11. The final time step is at t = 15000 seconds. The experimental image is from [6].
Fig. 13
Fig. 13
Simulation of region with Wg production set to its maximum rate independent of receptor binding for 0.012 < x < 0.016 causing localized increases in W and decreases in B. The final time step is at t = 15000 seconds. The experimental image from [6].

References

    1. Brook WJ, Cohen SM. Antagonistic interactions between wingless and decapentaplegic responsible for dorsal-ventral pattern in the drosophila leg. Science. 1996;273(5280):1373–1377. - PubMed
    1. Diaz-Benjumea FJ, Cohen SM. Wingless acts through the shaggy/zeste-white 3 kinase to direct dorsal- ventral axis formation in the drosophila leg. Development. 1994;120(6):1661–1670. - PubMed
    1. Entchev EV, Schwabedissen A, Gonzalex-Gaitan M. Gradient formation of the tgf-beta homolog dpp. Cell. 2000;103:981–991. - PubMed
    1. Gierer A, Meinhardt H. A theory of biological pattern formation. Kybernetik. 1972;12:30–39. - PubMed
    1. H M. Space-dependent cell determination under the control of morphogen gradient. J Theor Biol. 1978;74(2):307–321. - PubMed

Publication types