. 2008 Jul 9:5:60.
doi: 10.1186/1742-4690-5-60.

Viral complementation allows HIV-1 replication without integration

Affiliations

Viral complementation allows HIV-1 replication without integration

Huub C Gelderblom et al. Retrovirology. .

Abstract

Background: The integration of HIV-1 DNA into cellular chromatin is required for high levels of viral gene expression and for the production of new virions. However, the majority of HIV-1 DNA remains unintegrated and is generally considered a replicative dead-end. A limited amount of early gene expression from unintegrated DNA has been reported, but viral replication does not proceed further in cells which contain only unintegrated DNA. Multiple infection of cells is common, and cells that are productively infected with an integrated provirus frequently also contain unintegrated HIV-1 DNA. Here we examine the influence of an integrated provirus on unintegrated HIV-1 DNA (uDNA).

Results: We employed reporter viruses and quantitative real time PCR to examine gene expression and virus replication during coinfection with integrating and non-integrating HIV-1. Most cells which contained only uDNA displayed no detected expression from fluorescent reporter genes inserted into early (Rev-independent) and late (Rev-dependent) locations in the HIV-1 genome. Coinfection with an integrated provirus resulted in a several fold increase in the number of cells displaying uDNA early gene expression and efficiently drove uDNA into late gene expression. We found that coinfection generates virions which package and deliver uDNA-derived genomes into cells; in this way uDNA completes its replication cycle by viral complementation. uDNA-derived genomes undergo recombination with the integrated provirus-derived genomes during second round infection.

Conclusion: This novel mode of retroviral replication allows survival of viruses which would otherwise be lost because of a failure to integrate, amplifies the effective amount of cellular coinfection, increases the replicating HIV-1 gene pool, and enhances the opportunity for diversification through errors of polymerization and recombination.


Figures

Figure 1
Figure 1
Gene expression from cells infected with integrating and non-integrating HIV-1 reporter viruses. NLENG1-ES-IRES [43] ("WT-GFP") or an integrase D116N mutant version of NLENG1-ES-IRES ("D116N-GFP"), each pseudotyped with VSV-G protein, were used to infect Jurkat cells (4.4 ng p24 on 2 × 10^5 cells) and analyzed by flow cytometry 48 and 72 hours after infection. Integrase inhibitor 118-D-24, or DMSO carrier, was applied to some cells at 200 μM at the time of infection with integrase-WT virus. Data are representative of several independent experiments. Table shows the percentage of cells that were GFP+ ("% Pos.") and the mean fluorescence (MF) of the GFP+ cells divided by the background fluorescence of the GFP-negative cells ("MF(+/-)"). "Product" is the % Pos. multiplied by the MF(+/-) and represents the overall GFP gene expression from the infected cells. Numbers in parentheses represent the fold reduction vs. WT virus. "II" = integrase inhibitor. Dot plots show GFP fluorescence in the X axis and arbitrarily chosen red background fluorescence on the Y-axis.
Figure 2
Figure 2
Activation of uDNA gene expression by coinfection with integrating virus. A. Upper panels: 2 × 10^5 Jurkat cells were left uninfected (left panel) or infected with increasing amounts of WT-DsRedX virus (5, 20, 60 ng p24 respectively). Lower panels: Cells were simultaneously infected with equal amounts of D116N-GFP virus (10 ng p24) and the same amount of WT-DsRedX virus as in the panel directly above. Numbers represent the percentage of cells in each indicated quadrant. All viruses were envelope-defective and pseudotyped with VSV-G protein to limit viruses to a single round of replication. B. The solid blue line plots the percentage of cells that express D116N-associated GFP fluorescence from the lower panels in A (Y axis) as a function of the amount of WT-DsRedX infection (X axis). Extrapolation to 100% infection with WT-DsRedX virus implies that 42% of cells are infected with a D116N-GFP virus that is capable of generating fluorescence in the presence of a coinfecting integrating virus (dashed lines). C. Effect of Tat on the percentage of cells expressing D116N-associated GFP fluorescence. As in Figure 2A-B, viruses were envelope defective and pseudotyped with VSV-G to overcome differences in CD4 levels on Jurkat and Jurkat-Tat cells and to limit viruses to a single round of replication. qPCR for HIV-1 DNA found equal infection of Jurkat and Jurkat-Tat cells with 0.9 HIV-1 genomes/cell by real time DNA qPCR. A nearly 7-fold increase in the percentage of cells expressing D116N-associated GFP fluorescence is similar to results of coinfection in panel B and demonstrates that Tat is sufficient for the transactivation provided by coinfecting viruses. This experiment is representative of multiple independent experiments. D. The increase in mean fluorescence in Jurkat from D116N-GFP virus as a result of coinfection with an integrase-WT virus as a result of Tat transactivation in the Jurkat-Tat cell line. Coinfection data represent the mean fluorescence of cells coinfected with D116N-GFP and WT-DsRedX viruses divided by the mean fluorescence of cells infected with only D116N-GFP virus. Data represent multiple samples from each of 3 independent experiments. Tat data represent the mean fluorescence of GFP+ Jurkat-Tat cells divided by the mean fluorescence of GFP+ Jurkat cells infected with D116N-GFP virus. The average and SD are derived from multiple samples of a representative experiment.
Figure 3
Figure 3
Late HIV-1 gene expression from integrating and non-integrating HIV-1. Activated primary T cells were infected with A. a WT-GFP virus, B. a D116N-GFP/HSA dual reporter virus or C. coinfected with the D116N-GFP/HSA dual reporter and a WT-DsRedX virus. Cells were analyzed by flow cytometry 48 hours after infection. Upper panels show all infected cells, total infection rates, and the gates applied for analysis in the lower panels. Lower panels show Rev-independent early gene expression (GFP) vs. Rev-dependent late gene expression (HSA). Gating is on the fluorescent cells in the top panels in order to highlight the ratio of cells displaying early (GFP+HSA- cells) to those exhibiting late HIV-1 expression (GFP+HSA+ cells). Data are representative of several independent experiments. Similar results are obtained with Jurkat cells.
Figure 4
Figure 4
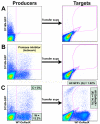
Completion of the HIV-1 replication cycle by uDNA via coinfection with an integrating virus. Jurkat cells were infected with D116N-GFP virus only, washed and incubated with protease to remove residual virus, then 2 days later the resulting culture supernatants were used to infect Jurkat-Tat target cells. A. Cells containing only uDNA show little infectious virus output. B. Cells that were coinfected with WT-DsRedX and D116N-GFP viruses and treated with HIV-1 protease inhibitor Indinavir show little virus output. C. Procedures followed as in B, except no Indinavir was present. Virus transfer to Jurkat-Tat target cells results in both DsRedX fluorescence and GFP fluorescence, indicating that infectious viruses were generated which package and deliver functional genomes derived from unintegrated D116N-GFP DNA within the producer cells. Data are representative of multiple independent experiments. "C = 3%", "W", "G", "R" refer to figure 5.
Figure 5
Figure 5
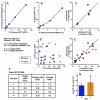
Measurement of the efficiency of uDNA replication during coinfection. A. The relationship between the infection of producer cells with WT-DsRedX virus and the presence of producer cells displaying fluorescence from both WT-DsRedX and D116N-GFP viruses. The same amount of D116N-GFP virus was used to infect each population of cells, yielding 4.5% GFP+ cells without addition of WT-DsRedX virus. As increasing amounts of WT-DsRedX virus are used to coinfect cells, the percentage of cells displaying both GFP and DsRedX fluorescence increased linearly, as shown. Data were collected day 2 after infection of producer cells, at the time of virus transfer to target cells. Values represent the percentage of producers that were double-positive (X axis) vs. the percentage of producers that were DsRedX+ (both single and double positive). B. The relationship between the frequency of double positive GFP+DsRedX+ producer cells and the frequency of the resulting GFP+ target cells. C. Relationship between the GFP+ producer cells and the ratio of D116N-GFP and WT-DsRedX viruses conferred to target cells. The X axis predicts the percentage of viruses generated by producer cells that will confer GFP to target cells. The formula for the X axis assumes equal production of D116N-GFP and WT-DsRedX viruses from double positive producer cells and production of only DsRedX viruses from DsRedX+ cells. The Y axis presents the percentage of all fluorescent target cells that are GFP+. In the target cells, all GFP+ cells (G) and DsRedX+ cells (R) are tallied, and cells which are double positive GFP+DsRedX+ are counted in both categories. The red line represents unity between the two formulas, where the assumptions used in the X axis formula are true. D. The experiment presented in A-C was repeated using primary activated CD4+ T cells as producers, and the percentage of D116N-GFP and WT-DsRedX in each producer cell population is shown to illustrate the wide range of MOI and WT/D116N ratios employed. Blue squares represent producer cells on day 2 after infection and orange circles represent producer cells on day 3 after infection. Data are aggregated from 3 independent experiments. E. The relationship between producer and target cells as in Figure 5C using primary T cell producer cells, showing data from the 3 independent experiments in Figure 5D. F. WT-DsRedX to D116N-GFP ratio in the target cells by flow cytometry and DNA PCR, and by RT-PCR on the viruses used to infect them. Numbers represent the ratio of DsRedX+ cells to GFP+ cells, or the ratio of WT-DsRedX to D116N-GFP nucleic acid in indicated samples. This experiment is representative of two independent experiments. G. Averages and standard deviations for the cumulative data in Figure 5E.
Figure 6
Figure 6
Phenotypic complementation between WT and D116N in virions. Target cells from virus transfer experiment in Figure 4. Two days after infection of target cells bright and dim GFP+ cells were sorted by FACS, then qPCR for integrated DNA was performed on the sorted cells. The integration of D116N-GFP DNA demonstrates that integrase mutant genomes are complemented by WT integrase within virions.
Figure 7
Figure 7
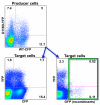
Recombination between uDNA-derived and iDNA-derived genomes. Jurkat cells were simultaneously infected with D116N-YFP and WT-CFP viruses and a virus transfer experiment performed as in Figure 4. The appearance of GFP+ target cells is strictly dependent upon copackaging of YFP and CFP genomes into virions during virus assembly in producer cells and reverse transcription during second round infection of target cells [43]. Numbers represent the percentage of cells in each quadrant. Data are representative of multiple independent experiments.

References

    1. Brown PO. Integration. In: Coffin JM, Hughes SH, Varmus HE, editor. Retroviruses. Plainview NY: Cold Spring Harbor Laboratory Press; 1997. pp. 161–203. - PubMed
    1. Freed EO. HIV-1 replication. Somatic cell and molecular genetics. 2001;26:13–33. doi: 10.1023/A:1021070512287. - DOI - PubMed
    1. Hindmarsh P, Leis J. Retroviral DNA integration. Microbiol Mol Biol Rev. 1999;63:836–843. table of contents. - PMC - PubMed
    1. Peterson S, Reid AP, Kim S, Siliciano RF. Treatment Implications of the Latent Reservoir for HIV-1. Advances in pharmacology (San Diego, Calif) 2007;55:411–425. - PubMed
    1. Chun TW, Carruth L, Finzi D, Shen X, DiGiuseppe JA, Taylor H, Hermankova M, Chadwick K, Margolick J, Quinn TC, et al. Quantification of latent tissue reservoirs and total body viral load in HIV-1 infection. Nature. 1997;387:183–188. doi: 10.1038/387183a0. - DOI - PubMed

Publication types