. 2008 Jul 11;134(1):74-84.
doi: 10.1016/j.cell.2008.05.029.

Rapid, transcription-independent loss of nucleosomes over a large chromatin domain at Hsp70 loci

Affiliations

Rapid, transcription-independent loss of nucleosomes over a large chromatin domain at Hsp70 loci

Steven J Petesch et al. Cell. .

Abstract

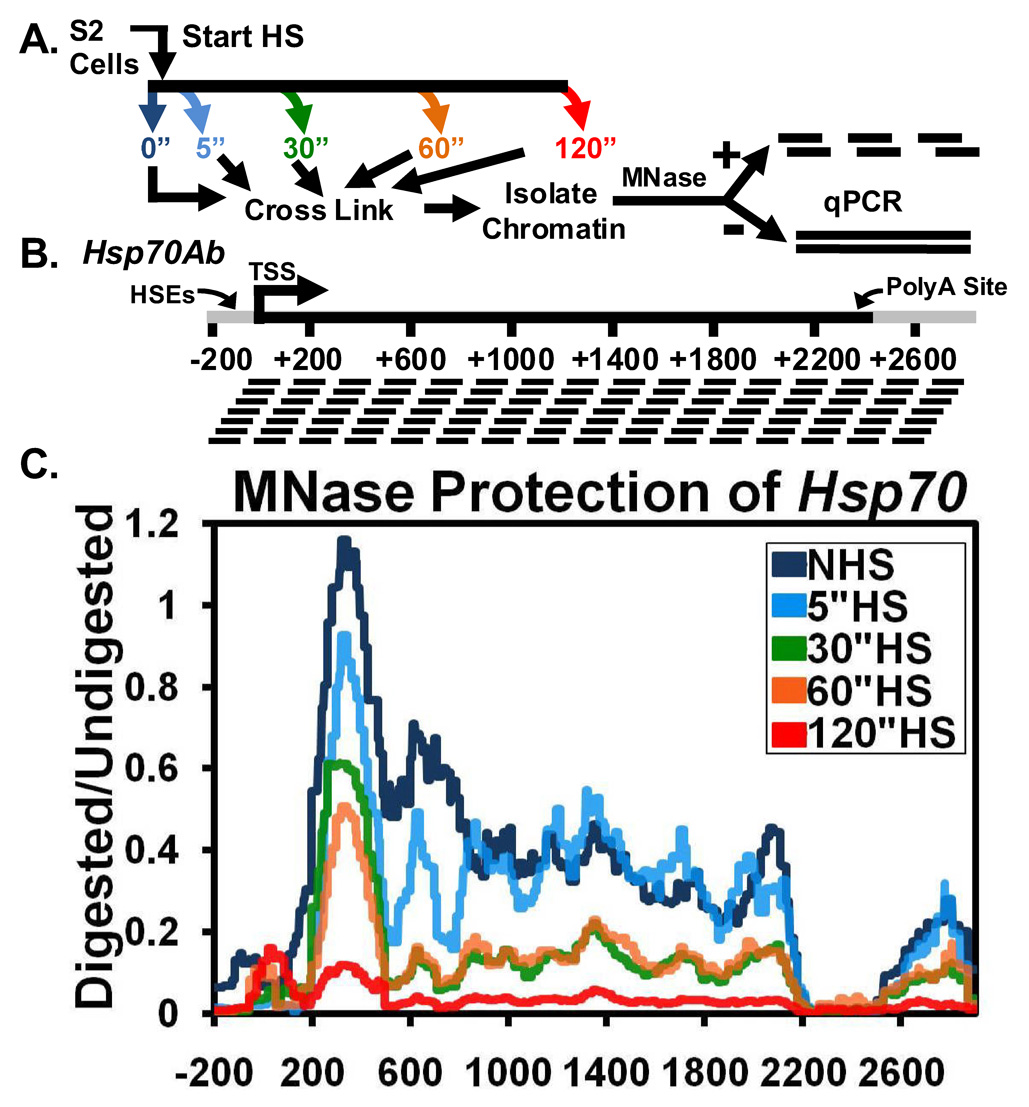
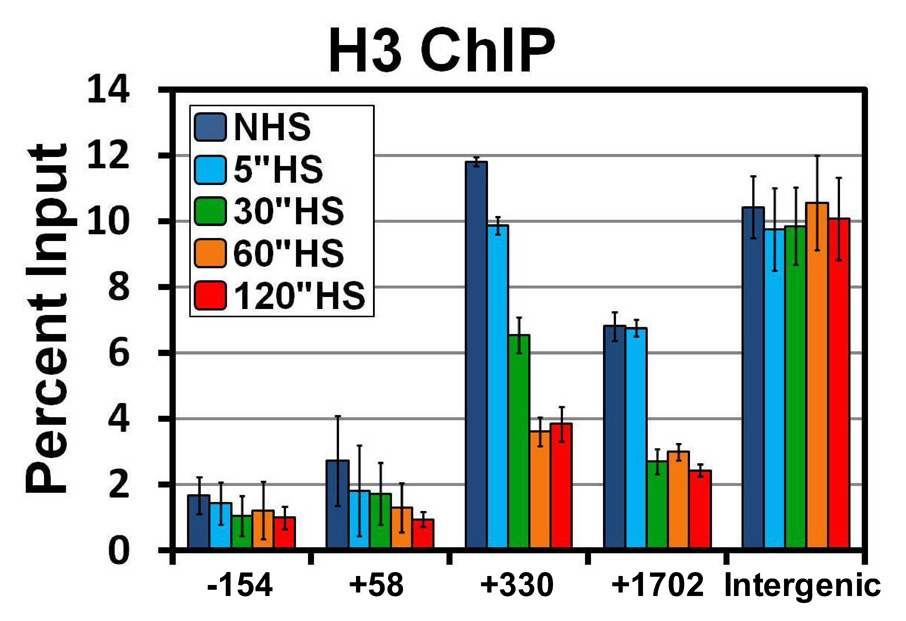
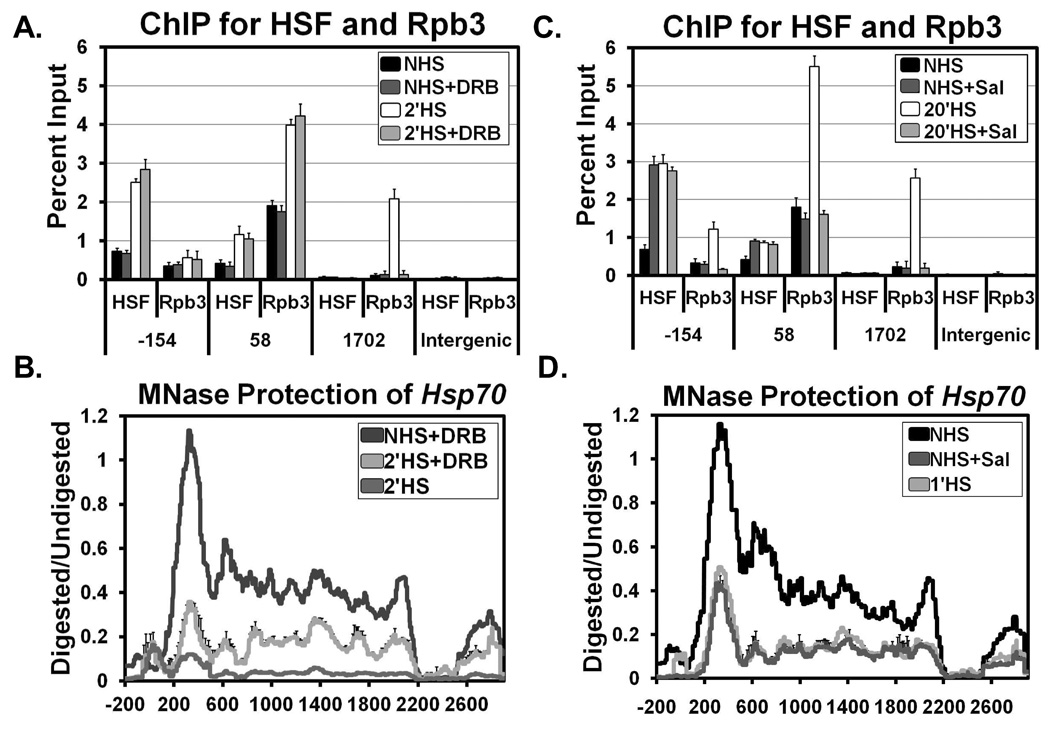
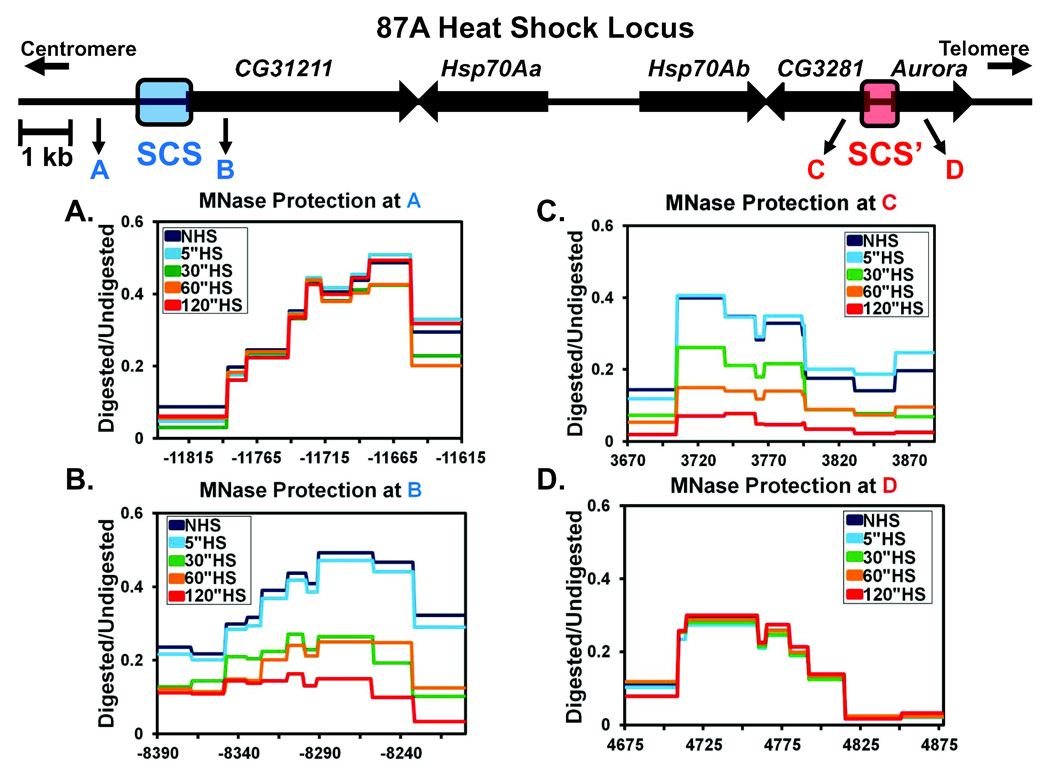
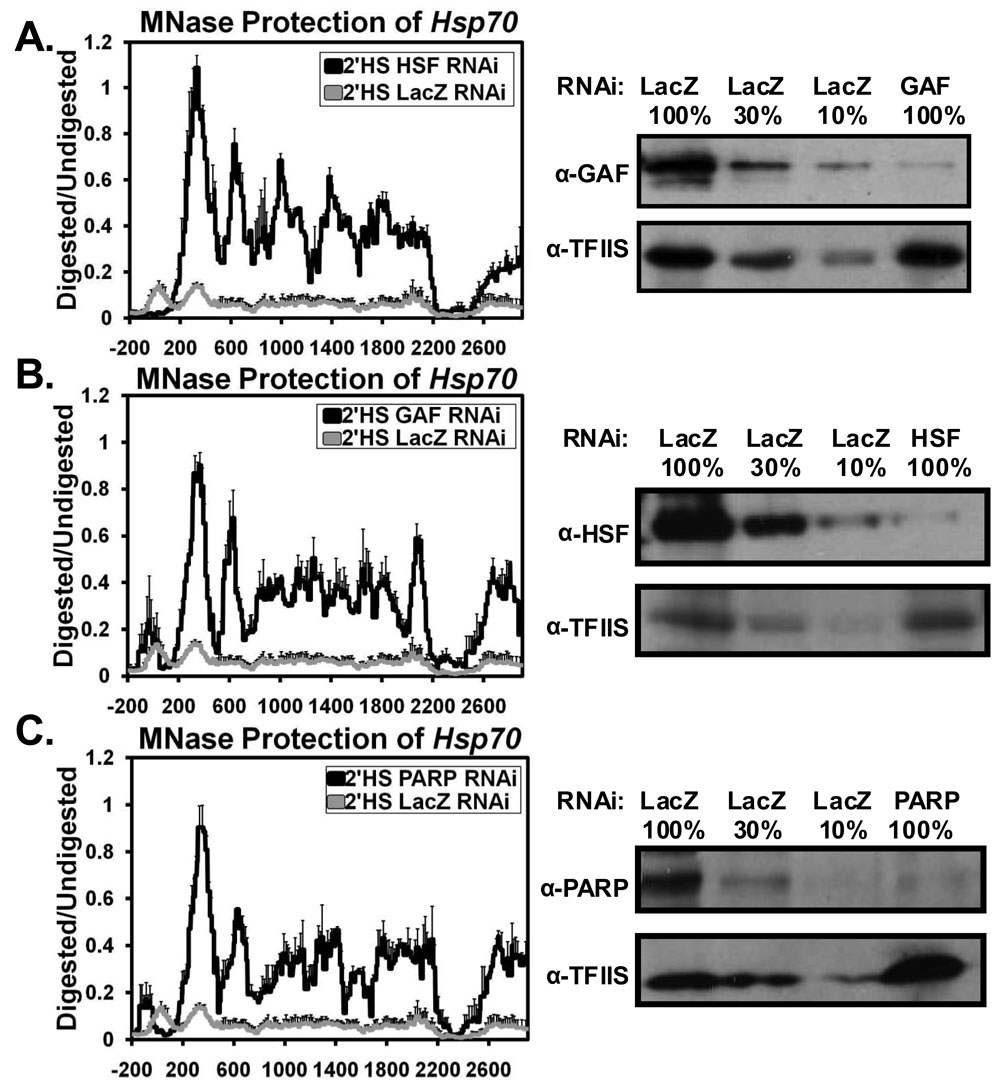
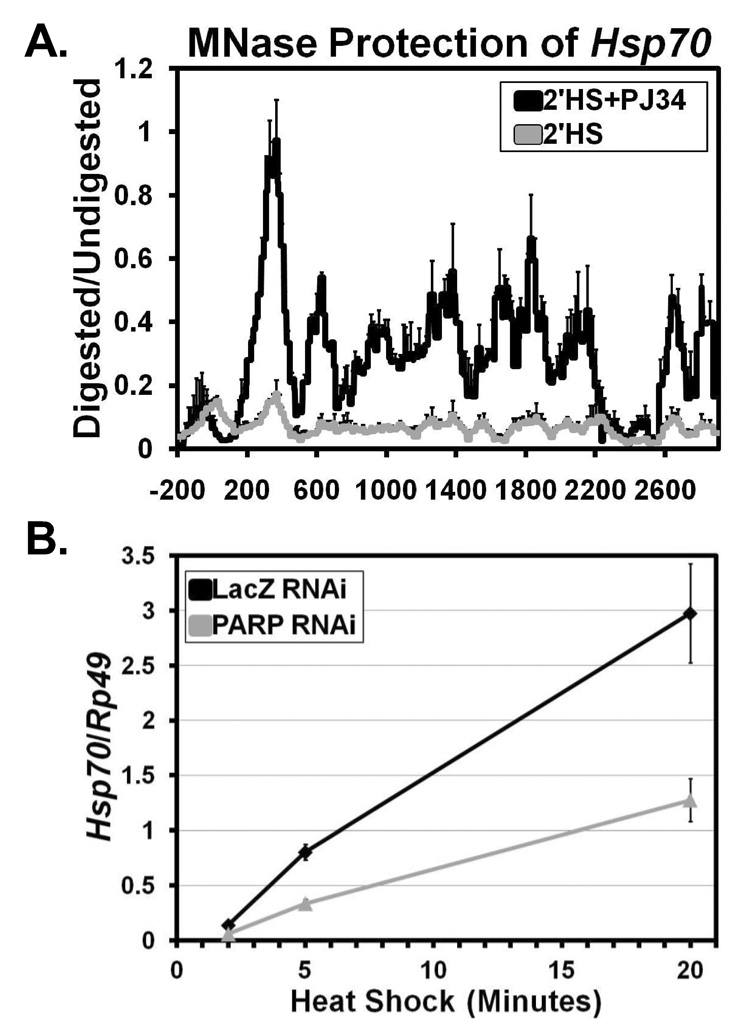
To efficiently transcribe genes, RNA Polymerase II (Pol II) must overcome barriers imposed by nucleosomes and higher-order chromatin structure. Many genes, including Drosophila melanogaster Hsp70, undergo changes in chromatin structure upon activation. To characterize these changes, we mapped the nucleosome landscape of Hsp70 after an instantaneous heat shock at high spatial and temporal resolution. Surprisingly, we find an initial disruption of nucleosomes across the entire gene within 30 s after activation, faster than the rate of Pol II transcription, followed by a second further disruption within 2 min. This initial change occurs independently of Pol II transcription. Furthermore, the rapid loss of nucleosomes extends beyond Hsp70 and halts at the scs and scs' insulating elements. An RNAi screen of 28 transcription and chromatin-related factors reveals that depletion of heat shock factor, GAGA Factor, or Poly(ADP)-Ribose Polymerase or its activity abolishes the loss of nucleosomes upon Hsp70 activation.


Figures

Figure 1
Figure 1. Rapid Loss of Chromatin Structure at Hsp70 upon Heat Shock Detected by a High Resolution MNase Scanning Assay
(A) Diagram depicting the procedure followed for the high resolution MNase assay. S2 cells are heat shocked for 0 (dark blue), 5 (light blue), 30 (green), 60 (orange), or 120 seconds (red) (colors refer to 1C), immediately cooled to room temperature and crosslinked, and their chromatin is isolated. Purified DNA products from samples are treated with 0 or 500 U of MNase and used for qPCR. (B) Diagram showing the PCR amplicons used at the Hsp70Ab gene. PCR products are 100±5 bp in size and are spaced 30±6 bp apart. The mRNA-encoding unit is shown in black. The gene nucleotide location, corresponding to panel C, is numbered below with the HSEs, TSS, and PolyA site (at +2343) indicated. (C) The HS time course chromatin profile of Hsp70 is determined by normalizing the amount of the MNase digested PCR product to that of the undigested product using the ΔC(t) method (y-axis), which is plotted against the gene nucleotide location (x-axis). Values from overlapping primer sets are averaged. The x-axis represents base pair units with 0 being the TSS. Lines represent the average of 3 separate experiments with error bars omitted for clarity.
Figure 2
Figure 2. Rapid loss of Histone H3 from Hsp70 upon Heat Shock
Histone density across the Hsp70 gene detected by ChIP using an H3 antibody. S2 cells are heat shocked for 0 (dark blue), 5 (light blue), 30 (green), 60 (orange), or 120 seconds (red). The y-axis represents the percent of input material immunoprecipitated. Error bars represent the SEM of 3 independent experiments. The x-axis represents base pair units along the Hsp70 gene with 0 as the TSS; each number represents the center of the PCR amplicon. The intergenic region represents a region 32 kb downstream of Hsp70Bc that does not change upon HS.
Figure 3
Figure 3. Initial Loss of Nucleosomes at Hsp70 is Independent of Transcription
(A) ChIP at Hsp70 for HSF and Rpb3 (Pol II) with and without 125 µM of the transcription inhibitor DRB before (NHS, black bars and NHS+DRB, dark gray bars) and during HS (2’HS, white bars and 2’HS+DRB, light gray bars). The y-axis represents the percent of input material immunoprecipitated. x-axis values represent base pair units centered on the HSEs (−154), the Pol II pause site (+58), a downstream region (+1702), and an intergenic region outside the scs and scs’ regions. Error bars represent the SEM of 3 independent experiments. (B) MNase protection profile of NHS with DRB (dark gray), 2’HS with DRB (light gray), and 2’HS (medium gray) as in Figure 1C. Lines represent the average of 3 separate experiments. Error bars representing the SEM are plotted just for the 2’HS+DRB line for clarity. (C) ChIP as described in (A) except with and without 10 mM of sodium salicylate before (NHS, black bars and NHS+salicylate, dark gray bars) and during HS (20’HS, white bars and 20’HS+salicylate, light gray bars). Error bars represent the SEM of 3 independent experiments. (D) MNase protection profile as in (B) with NHS (black), NHS+salicylate (dark gray), and 1’HS (light gray). Lines represent the average of 3 separate experiments. Error bars representing the SEM are plotted just for the NHS+salicylate line for clarity.
Figure 4
Figure 4. The scs and scs’ Regions Insulate the Heat Shock Locus from the Spread of Nucleosome Loss
(A –D) MNase HS time course protection as in Figure 1C flanking the scs and scs’ insulators. The 87A HS locus shown above depicts the 4 sites analyzed flanking scs and scs’. Regions A and C are outside and B and D are inside of the scs and scs’ insulators respectively. Regions A–D also correspond to A–D in the graphs. The x-axis of all 4 graphs uses the TSS of the Hsp70Ab copy as the 0 point. Each line represented is the average of 3 independent experiments. Error bars are omitted for clarity but the SEM from 3 independent experiments is less than ±0.06.
Figure 5
Figure 5. HSF, GAF, and PARP are Essential for the Loss of Nucleosomes at Hsp70
MNase protection profile as in Figure 1C comparing the chromatin architecture following an RNAi depletion of either (A) HSF, (B) GAF, or (C) PARP (black lines) in comparison to a control RNAi depletion of LacZ (gray lines) after a 2’HS at Hsp70. Each line represents the average of 3 independent experiments with error bars representing the SEM. Western blots showing corresponding knockdown of HSF, GAF, or PARP are shown to the right of each figure with TFIIS used as a loading control and a serial dilution of LacZ RNAi to quantify each knockdown.
Figure 6
Figure 6. The Enzymatic Activity of PARP is Needed for Nucleosome Loss at Hsp70 and PARP is Required for full Hsp70 Expression
(A) MNase protection profile of Hsp70 as in Figure 1C comparing the chromatin architecture of S2 cells treated (black line) or not treated (gray line) with the PARP enzymatic inhibitor PJ34 after a 2’HS. Each line represents the average of 3 independent experiments with error bars representing the SEM. (B) Hsp70 mRNA levels following a 2, 5, and 20 minute HS were measured for S2 cells RNAi depleted of LacZ (black) or PARP (gray). Hsp70 expression levels were measured by oligo dT primed reverse transcription followed by qPCR using specific Hsp70Ab primers. Hsp70 mRNA levels are normalized to the Rp49 gene with error bars representing the SEM of 3 replicates.

Comment in

References

    1. Adelman K, Marr MT, Werner J, Saunders A, Ni Z, Andrulis ED, Lis JT. Efficient release from promoter-proximal stall sites requires transcript cleavage factor TFIIS. Mol. Cell. 2005;17:103–112. - PubMed
    1. Adelman K, Wei W, Ardehali MB, Werner J, Zhu B, Reinberg D, Lis JT. Drosophila Paf1 modulates chromatin structure at actively transcribed genes. Mol. Cell. Biol. 2006;26:250–260. - PMC - PubMed
    1. Albert I, Mavrich TN, Tomsho LP, Qi J, Zanton SJ, Schuster SC, Pugh BF. Translational and rotational settings of H2A.Z nucleosomes across the Saccharomyces cerevisiae genome. Nature. 2007;446:572–576. - PubMed
    1. Boehm AK, Saunders A, Werner J, Lis JT. Transcription factor and polymerase recruitment, modification, and movement on dhsp70 in vivo in the minutes following heat shock. Mol. Cell. Biol. 2003;23:7628–7637. - PMC - PubMed
    1. Bortvin A, Winston F. Evidence that Spt6p controls chromatin structure by a direct interaction with histones. Science. 1996;272:1473–1476. - PubMed

Publication types

MeSH terms