. 2008 Jul 11;134(1):97-111.
doi: 10.1016/j.cell.2008.04.052.

LXR signaling couples sterol metabolism to proliferation in the acquired immune response

Affiliations

LXR signaling couples sterol metabolism to proliferation in the acquired immune response

Steven J Bensinger et al. Cell. .

Abstract

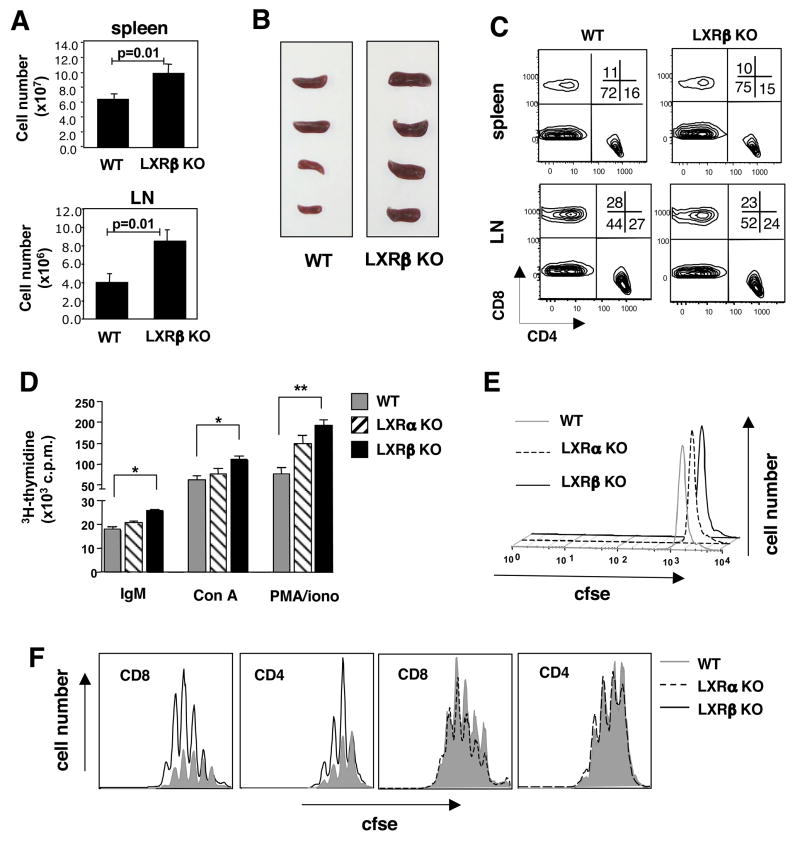
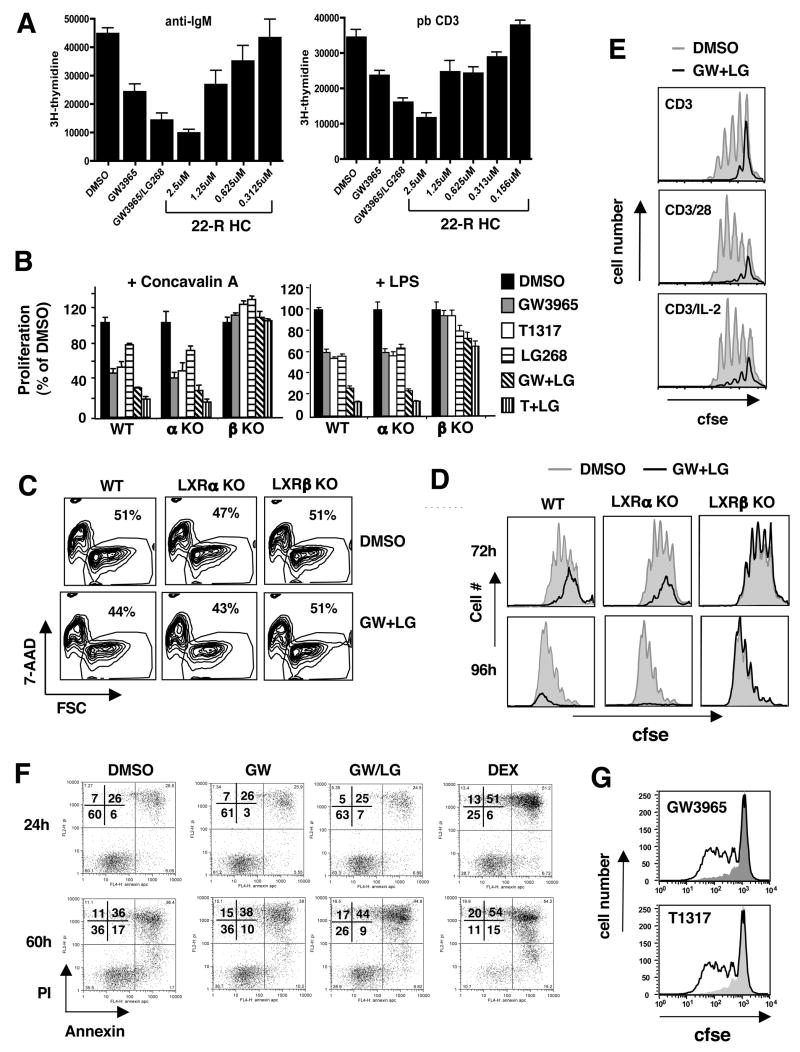
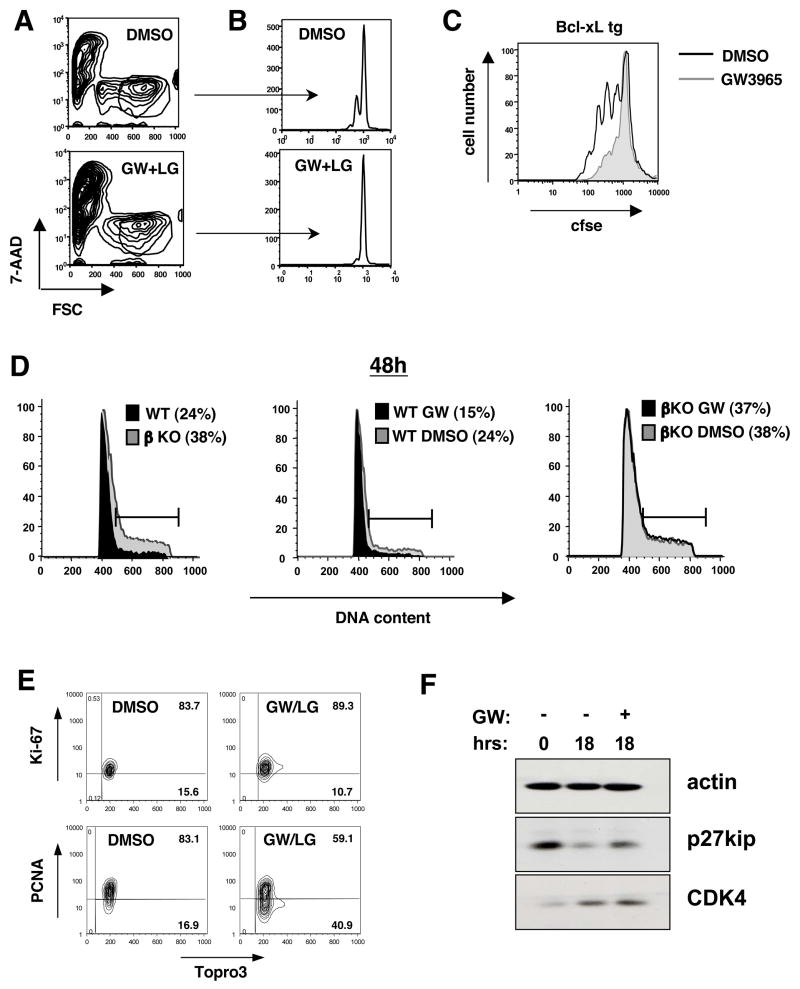
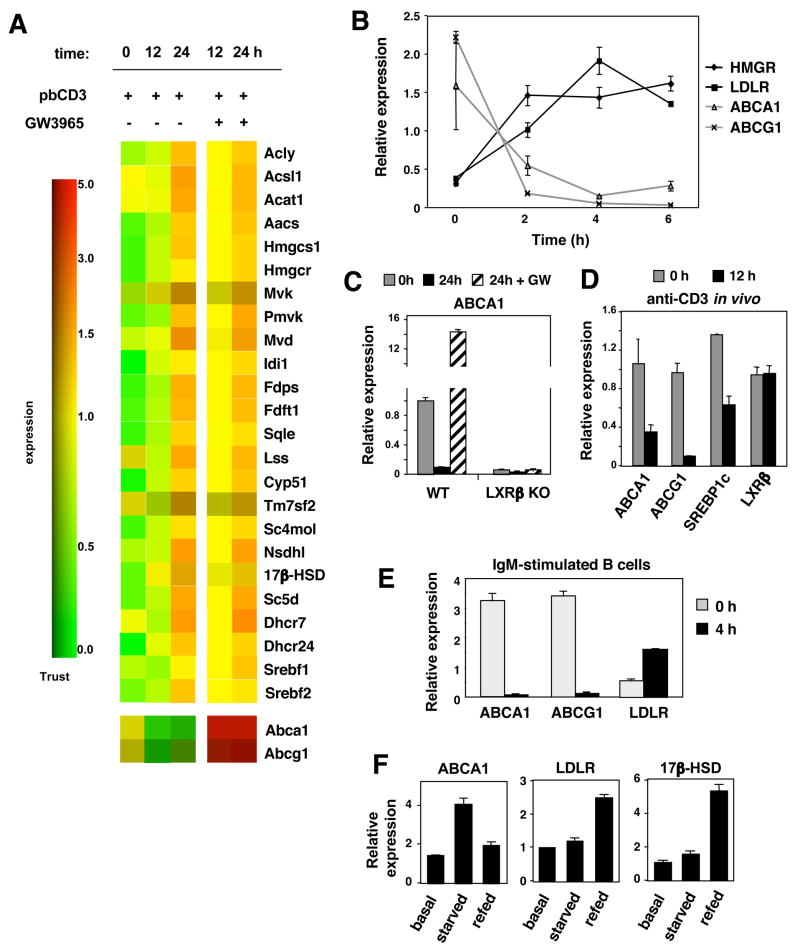
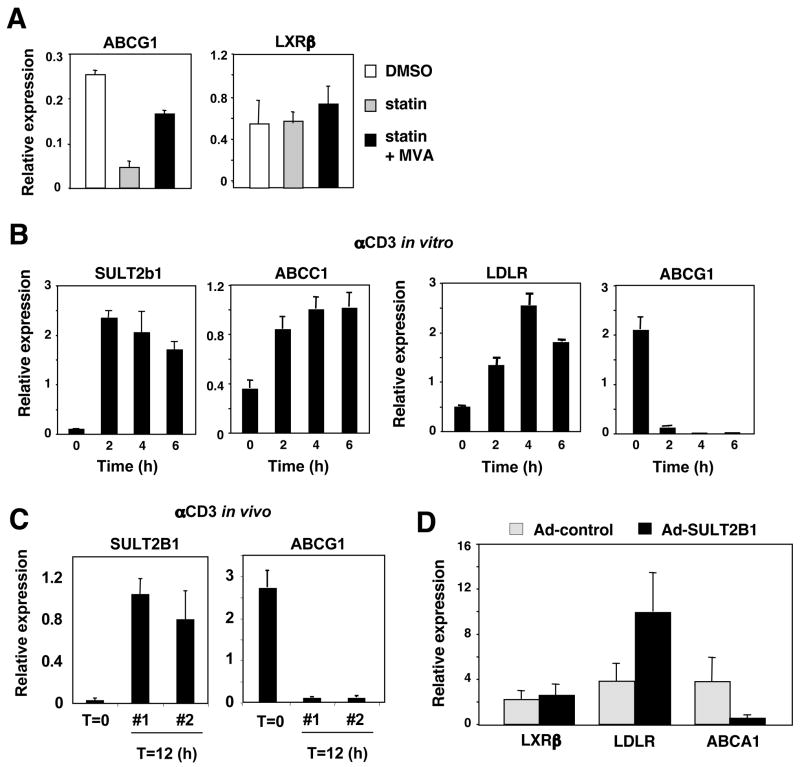
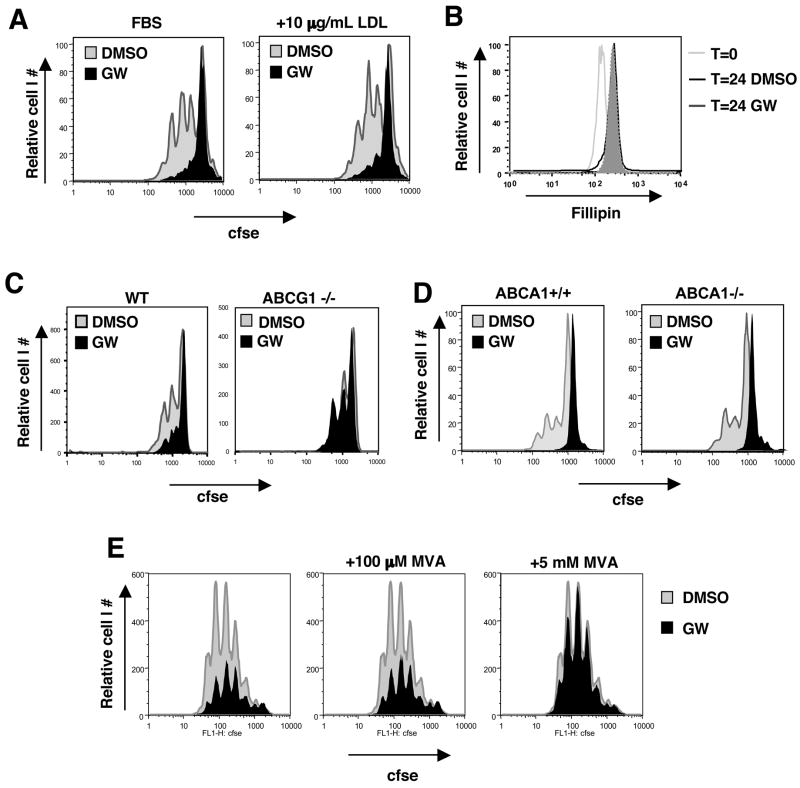
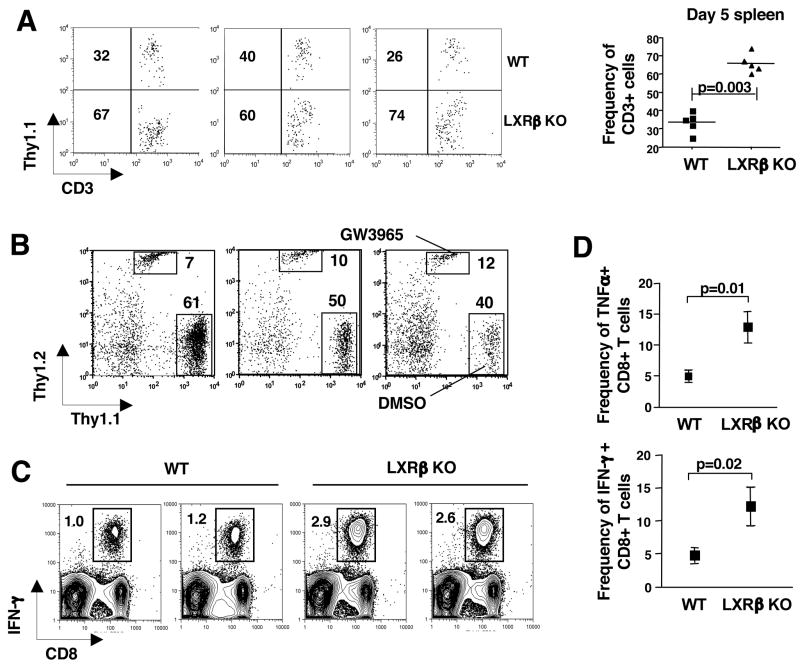
Cholesterol is essential for membrane synthesis; however, the mechanisms that link cellular lipid metabolism to proliferation are incompletely understood. We demonstrate here that cellular cholesterol levels in dividing T cells are maintained in part through reciprocal regulation of the LXR and SREBP transcriptional programs. T cell activation triggers induction of the oxysterol-metabolizing enzyme SULT2B1, consequent suppression of the LXR pathway for cholesterol transport, and promotion of the SREBP pathway for cholesterol synthesis. Ligation of LXR during T cell activation inhibits mitogen-driven expansion, whereas loss of LXRbeta confers a proliferative advantage. Inactivation of the sterol transporter ABCG1 uncouples LXR signaling from proliferation, directly linking sterol homeostasis to the antiproliferative action of LXR. Mice lacking LXRbeta exhibit lymphoid hyperplasia and enhanced responses to antigenic challenge, indicating that proper regulation of LXR-dependent sterol metabolism is important for immune responses. These results implicate LXR signaling in a metabolic checkpoint that modulates cell proliferation and immunity.


Figures

Figure 1
Figure 1. Splenomegaly and lymphocyte expansion in mice lacking LXRβ
(A) Total cellularity of spleen and LN from 6 month-old WT and LXRβ KO mice. (B) Gross morphology of spleens. (C) Frequency of CD4 and CD8 T cells from spleen and LN. (D) Mitogen-driven proliferation of spleen cells from 6–8 week old WT, LXRα KO or LXRβ KO mice. Cells were stimulated with anti-IgM(Fab′)2 (10μg/mL), Con A (10μg/mL), or PMA (0.5μM) and ionomycin (100mM). 3H-thymidine was added to cultures after 72 h for the final 16 h. *p<0.01; **p<0.001. (E,F) TCR- driven proliferation of spleen cells from WT, LXRα KO or LXRβ KO mice. Purified CFSE labeled T cells were stimulated with pbCD3 (10μg/mL). Cells were harvested at 24 h (E) and 72 h (F), stained with anti-CD4, CD8, and 7-AAD. 5×10⁴ counting beads were added to samples to serve as an internal control.
Figure 2
Figure 2. LXR activation inhibits lymphocyte proliferation
(A) Decreased mitogen-driven proliferation of WT spleen cells stimulated with anti-IgM(Fab′)2 (10μg/mL) or pbCD3 (10μg/mL) and LXR ligands GW3965 (2μM), 22(R)-hydroxycholesterol (0.156 μM–2.5μM) or RXR ligand LG268 (100 nM) as indicated. 3H-thymidine was added to cultures after 72 h for the final 16 h. (B) WT, LXRα KO or LXRβ KO splenocytes were stimulated with ConA (10μg/mL) or LPS (100μg/mL) and treated with LXR ligands GW3965 (2μM), T1317 (1μM) and RXR ligand LG268 (100nM) as indicated. 3H-thymidine was added to cultures after 72 h for the final 16 h. (C,D) CFSE dilution and viability of purified WT, LXRα KO or LXRβ KO T cells stimulated with pbCD3 in the presence of GW3965 and LG268 was determined at 24–96 h. (E) CFSE dilution of purified WT T cells at 72 h stimulated with pbCD3, soluble CD28, rIL-2, LXR/RXR agonist as indicated. (F) Annexin and PI staining of pbCD3 stimulated WT T cells cultured with GW3965 and LG268. (G) CFSE dilution of human T cells stimulated with anti-CD3 crosslinked with pb goat anti-mouse and cultured with GW3965. 5×10⁴ counting beads were added to samples (panels C,D,E,G) to serve as an internal counting control and analyzed via flow cytometry.
Figure 3
Figure 3. LXRβ signaling regulates cell cycle progression
(A,B,C) CFSE dilution of WT and Bcl-xL tg T cells stimulated with pbCD3 (10μg/mL) for 36–96 h in the presence of GW3965 (2μM) and LG268 (100nM). Cells were stained with 7-AAD and analyzed by flow cytometry. (D) Cell cycle analysis of WT and LXRβ KO T cells stimulated with pbCD3 and GW3965 and LG268 as indicated. Cells were stained for DNA content with propidium iodide at 48h and analyzed by flow cytometry. (E,F) Cell cycle proteins of WT T cells stimulated with pbCD3 and GW3965 and LG268 as indicated. (E) Cells were permeabilized and stained for intracellular proliferation antigens Ki-67, PCNA and topro-3 for DNA content at 36h. (F) Whole cell lysates were collected and analyzed by Western blot for p27kip and CDK4 expression at 18h.
Figure 4
Figure 4. Reciprocal regulation of the LXR and SREBP-2 transcriptional programs during lymphocyte activation
(A) DNA microarray analysis of SREBP-2 and LXR target genes of purified WT T cells stimulated with pbCD3 and GW3965 (2μM). (B) Real-time PCR analysis of mRNA from purified WT T cells stimulated with pbCD3 (10μg/mL) for the indicated time. (C) Real-time PCR analysis of mRNA from purified WT and LXRβ KO T cells stimulated for 24 h with pbCD3 and GW3965 as indicated. (D) Real-time PCR analysis of LXR and LXR target genes from mRNA of purified WT T cells of mice treated with 20 μg anti-CD3e i.p. for 12 h. (E) Real-time PCR analysis of mRNA from purified WT B cells stimulated for 6h with anti-IgM and GW3965 as indicated. (F) Real-time PCR analysis of mRNA from proliferating (basal), serum starved (starved), and refed WT mouse embryonic fibroblasts.
Figure 5
Figure 5. Regulation of LXR signaling by SULT2b1 during T cell activation
(A) Real-time PCR analysis of LXRβ and ABCG1 from quiescent WT T cells cultured with simvastatin and 5 mM mevalonic acid. (B) Real-time PCR analysis of SULT2b1, ABCC1, LDLR and ABCG1 mRNA from purified WT T cells stimulated with anti-CD3 in vitro for the indicated times. (C) Real-time PCR analysis of SULT2b1 and ABCG1 mRNA from purified WT T cells stimulated for 12 h with anti-CD3 in vivo. (D) Real-time PCR analysis of LXRβ, LDLR and ABCA1 mRNA from CAR-tg T cells transduced with SULT2b1- containing or control Adenovirus.
Figure 6
Figure 6. LXR inhibits proliferation through Abcg1-dependent alteration of cholesterol homeostasis
(A) CFSE dilution of WT T cells stimulated with pbCD3 and GW3965 in the presence of 10μg/mL LDL for 60 h. (B) Cholesterol content of plasma membrane from WT T cells revealed by fillipin staining ex vivo or after 24 h stimulation with pbCD3 and GW3965 as indicated. (C,D) CFSE dilution of purified ABCG1−/−, ABCA1−/− and control T cells stimulated with pma and ionomycin in the presence of LXR ligands for 60 h. (e) CFSE dilution of purified WT T cells stimulated with pbCD3 for 96 h in the presence of GW3965 and mevalonic acid (MVA) as indicated.
Figure 7
Figure 7. LXR signaling regulates T cell proliferation and immunity
(A) Homeostatic proliferation of WT and LXRβ KO T cells. 1×10⁶ purified WT (Thy1.1+) and LXRβ KO T cells (Thy1.2+) were co-adoptively transferred into B6Rag −/− hosts. After 5 days, spleens were harvested and cells stained with anti-CD3 and Thy1.1 to determine the frequency of recovered T cells. Each FACS plot represents an individual mouse and graph represents 5 mice from one experiment. (B) Homeostatic proliferation of WT T cells stimulated with LXR/RXR ligands. WT (Thy1.2+) T cells were pre-treated with GW3965 in vitro for 18 h. Control (Thy1.1+) T cells were pre-treated with DMSO in vitro for 18 h. 1×10⁶ live cells per treatment group were co-adoptively transferred into B6Rag −/− hosts. After 5 days, spleens were harvested and cells stained with anti-CD3, Thy1.1 and Thy1.2. Each FACS plot represents an individual mouse of 5 mice from one experiment. (C,D) Increased antigen specific immune response in LXRβ KO mice. WT and in LXRβ KO mice were immunized with 1×10⁷ syngeneic MECs transfected with the human adenovirus type 5 early region 1 (Ad5e1). (C) The frequency of antigen-specific CD8+ T cells in whole spleen was enumerated ex vivo one week after immunization by intracellular IFN-γ staining after a short term in vitro restimulation with the E1B192-200 (VNIRNCCYI) peptide. FACS data presented is 2 mice per genotype representative of 4 mice per group. (D) The frequency of antigen specific IFN-γ and TNFα producing CD8 T cells within the CD8 T cell compartment. Data is presented as the mean +/− SEM of 4 mice per group. Each experiment was repeated twice.

References

    1. Alves NL, Derks IA, Berk E, Spijker R, van Lier RA, Eldering E. The Noxa/Mcl-1 axis regulates susceptibility to apoptosis under glucose limitation in dividing T cells. Immunity. 2006;24:703–716. - PubMed
    1. Beadling C, Smith KA. DNA array analysis of interleukin-2-regulated immediate/early genes. Med Immunol. 2002;1:2. - PMC - PubMed
    1. Bromley SK, Burack WR, Johnson KG, Somersalo K, Sims TN, Sumen C, Davis MM, Shaw AS, Allen PM, Dustin ML. The immunological synapse. Annu Rev Immunol. 2001;19:375–396. - PubMed
    1. Brown MS, Goldstein JL. Suppression of 3-hydroxy-3-methylglutaryl coenzyme A reductase activity and inhibition of growth of human fibroblasts by 7-ketocholesterol. J Biol Chem. 1974;249:7306–7314. - PubMed
    1. Castrillo A, Joseph SB, Vaidya SA, Haberland M, Fogelman AM, Cheng G, Tontonoz P. Crosstalk between LXR and toll-like receptor signaling mediates bacterial and viral antagonism of cholesterol metabolism. Mol Cell. 2003;12:805–816. - PubMed

Publication types