. 2008 Jul 11;134(1):162-74.
doi: 10.1016/j.cell.2008.05.031.

An RNAi screen of chromatin proteins identifies Tip60-p400 as a regulator of embryonic stem cell identity

Affiliations

An RNAi screen of chromatin proteins identifies Tip60-p400 as a regulator of embryonic stem cell identity

Thomas G Fazzio et al. Cell. .

Abstract

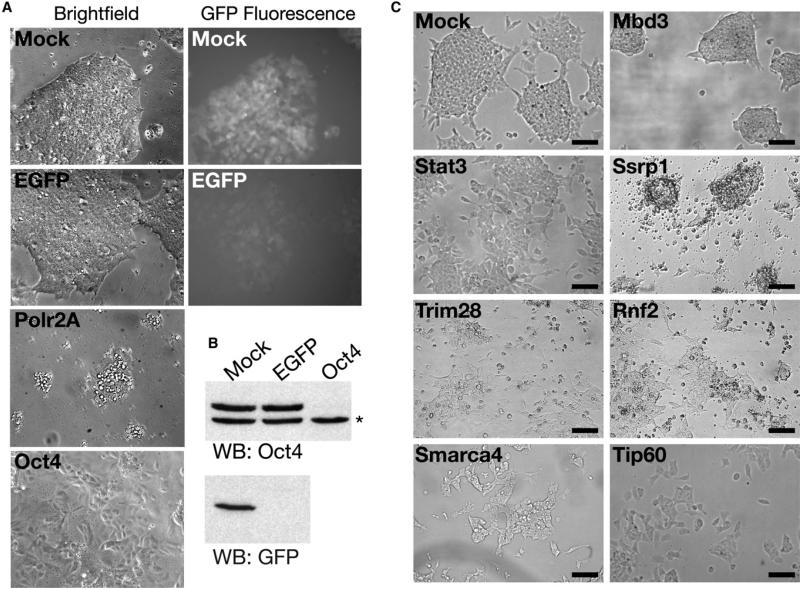
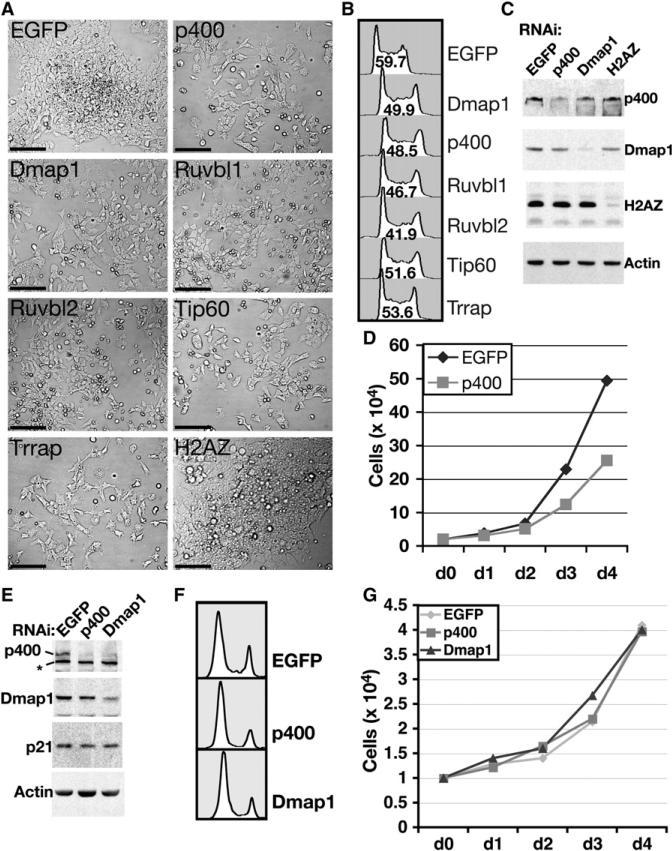
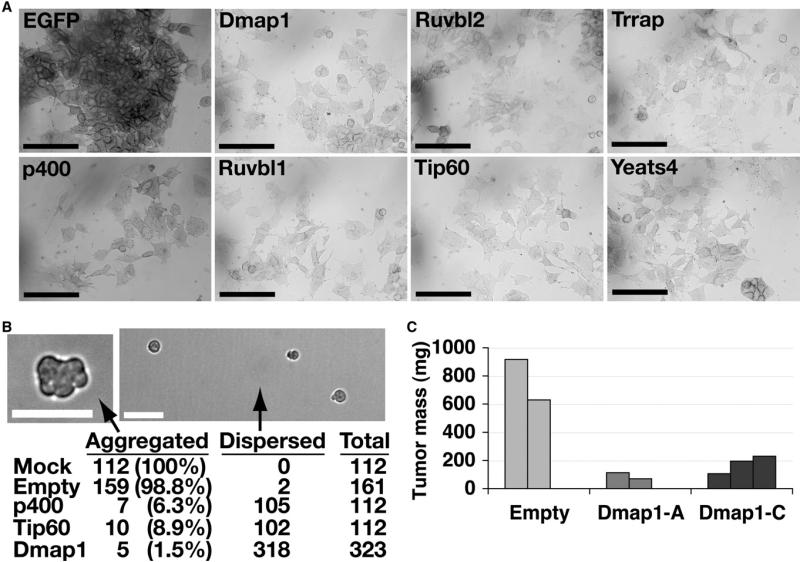
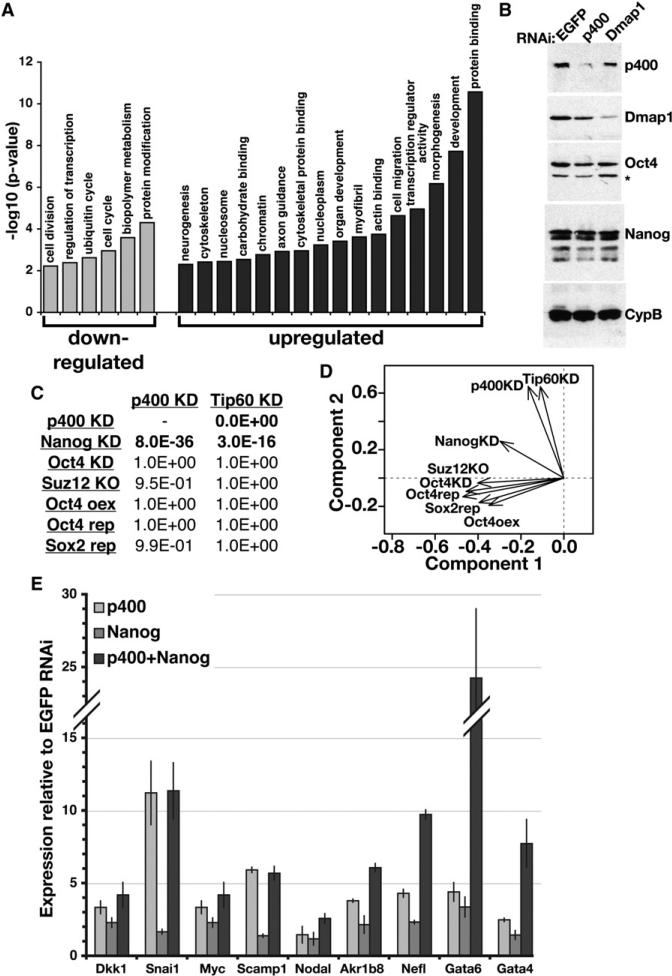
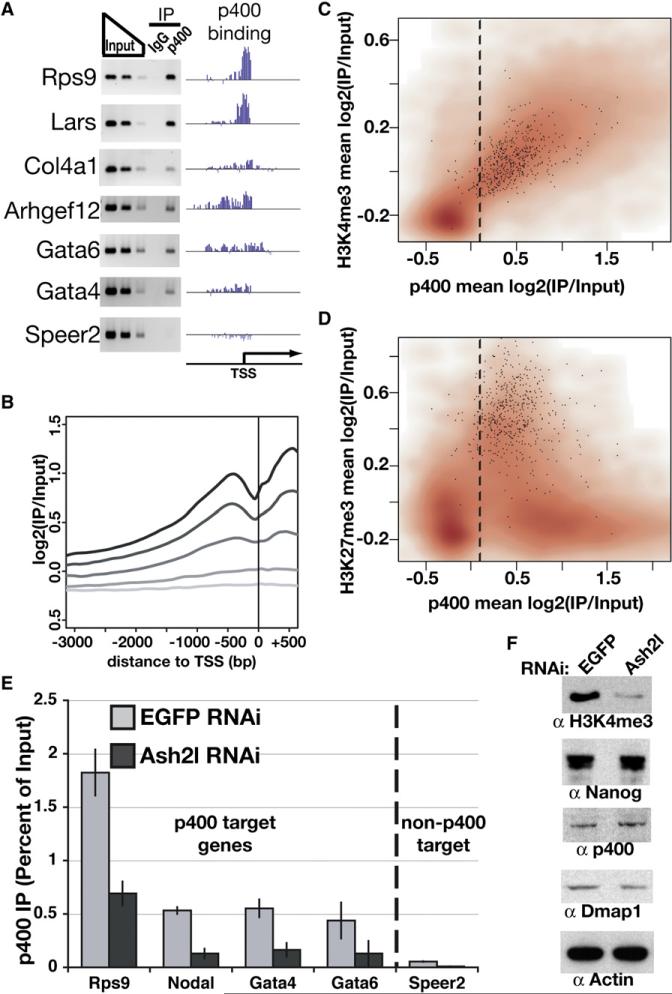
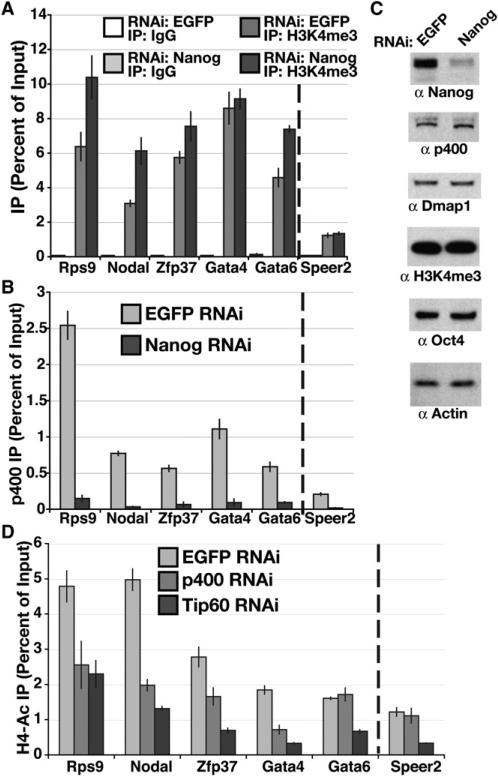
Proper regulation of chromatin structure is necessary for the maintenance of cell type-specific gene expression patterns. The embryonic stem cell (ESC) expression pattern governs self-renewal and pluripotency. Here, we present an RNAi screen in mouse ESCs of 1008 loci encoding chromatin proteins. We identified 68 proteins that exhibit diverse phenotypes upon knockdown (KD), including seven subunits of the Tip60-p400 complex. Phenotypic analyses revealed that Tip60-p400 is necessary to maintain characteristic features of ESCs. We show that p400 localization to the promoters of both silent and active genes is dependent upon histone H3 lysine 4 trimethylation (H3K4me3). Furthermore, the Tip60-p400 KD gene expression profile is enriched for developmental regulators and significantly overlaps with that of the transcription factor Nanog. Depletion of Nanog reduces p400 binding to target promoters without affecting H3K4me3 levels. Together, these data indicate that Tip60-p400 integrates signals from Nanog and H3K4me3 to regulate gene expression in ESCs.


Figures

Figure 1
Figure 1. Examples of Knockdown Phenotypes in ESCs
(A) esiRNAs silence effectively in ESCs. Brightfield and GFP fluorescence images of ESCs bearing an EGFP transgene transfected with indicated esiRNAs. Images were obtained after 4 days of KD, except for Polr2A, which was imaged after 2 days. (B) Western blotting of indicated proteins in ESCs knocked down as in (A). The asterisk indicates a background band in the Oct4 blot, which serves as a loading control. (C) Examples of phenotypes from the esiRNA screen. ESCs were mock-transfected or transfected with the indicated esiRNAs and imaged after 4 days. Scale bars equal 140 μm.
Figure 2
Figure 2. Phenotypes of ESCs and MEFs Depleted of Tip60-p400 Subunits
(A) Brightfield images of ESCs depleted of six Tip60-p400 subunits, as well as H2AZ or EGFP as controls. Scale bars equal 120 μm. (B) Cell cycle profiles of ESCs depleted of the indicated proteins. The percentage of cells in S-phase is indicated within each plot. Shown is one of two experiments with similar results. (C) Western blotting of indicated proteins from ESCs transfected with the indicated esiRNAs. (D) Growth curve of ESCs treated with indicated esiRNAs. Shown is one of two experiments with similar results. (E) Western blotting of indicated proteins from MEFs transfected with the indicated esiRNAs. The asterisk indicates a background band. (F) Cell cycle profiles of MEFs depleted of the indicated proteins. (G) Growth curve of MEFs treated with indicated esiRNAs. Shown is one of two experiments with similar results.
Figure 3
Figure 3. Tip60-p400 Is Required for Maintenance of ESC Identity
(A) AP staining of ESCs transfected for four days with the indicated esiRNAs. Scale bars equal 100 μm. (B) EB formation. Mock transfected, p400 KD, or Tip60 KD ESCs were aggregated in hanging drops. Alternatively, ESCs infected with an empty vector lentivirus or lentivirus expressing the Dmap1-A shRNA were aggregated. (Top) Brightfield images of empty vector (left) or Dmap1-A shRNA (right) ESCs. Scale bars equal 40 μm. (Bottom) Percentage of hanging drops in which ESCs aggregated or remained dispersed after 24 hr. (C) Tumor mass of teratomas formed from ESCs infected with lentiviruses expressing Dmap1 shRNAs or empty vector lentiviruses 21 days after injection into nude mice.
Figure 4
Figure 4. Overlapping Functions of Tip60-p400 and Nanog Revealed by Expression Profiling
(A) The significance of enrichment of a subset of Gene Ontology (GO) terms common among genes misregulated in p400 KD ESCs. Similar categories were enriched in the Tip60 KD dataset. (B) Protein levels of Tip60-p400 subunits (p400, Dmap1), TFs (Oct4, Nanog), and a loading control (cyclophilin B, CypB) were determined by Western blotting. The asterisk indicates a background band. (C) Comparison of ESC expression profiles upon KD, knockout (KO), inducible repression (rep) or overexpression (oex) of the indicated factors (Loh et al., 2006; Masui et al., 2007; Matoba et al., 2006; Pasini et al., 2007). p-values (one-sided Fisher's exact test) indicating statistical significance of overlap with Tip60 or p400 KD are shown. (D) Principal component analysis of gene expression profiles from (C). (E) RT-qPCR measuring mRNA levels of Nanogand Tip60-p400-target genes (indicated below) in ESCs depleted of p400, Nanog, or both, relative to control (EGFP)-depleted ESCs. Data are represented as mean ± SD.
Figure 5
Figure 5. Genome-Wide Location Analysis of p400
(A) PCR verification of p400 ChIP at genes with varying enrichment of p400. “p400 binding” plots p400 enrichment (y axis) for each probe (x axis) tiling the promoters indicated. (B) p400 enrichment was plotted relative to the TSS. Genes were binned into quintiles based on expression level in ESCs, ranging from highly expressed genes (black) to nonexpressed genes (lightest gray). (C and D) Density scatterplots of each gene promoter average for p400 enrichment versus H3K4me3 (Maherali et al., 2007) (C) or H3K27me3 (Maherali et al., 2007) (D) enrichment. Direct targets of Polycomb repressive complex 2 (PRC2) (Boyer et al., 2006) are indicated with black dots. The dashed line separates p400-enriched from nonenriched genes, as in Figure S6. (E) ChIP in Ash2l or EGFP KD ESCs for p400 measured by qPCR and expressed as a percentage of input. The dashed line separates p400 target genes (according to genome-wide location data and confirmed for several genes in Figure 5A) from a gene without p400 enrichment (Speer2), included as a control. IgG control qPCRs were near zero (Figure S12). Data are represented as mean ± SD. (F) Western blotting for the proteins indicated in EGFP and Ash2l KD ESCs.
Figure 6
Figure 6. H3K4me3 and Nanog Are Independently Required for p400 Localization
(A and B) ChIP in Nanog or EGFP KD ESCs for IgG and H3K4me3 (A) or p400 (B) at genes indicated. The dashed line separates p400 targets from a gene without p400 enrichment, as in Figure 5E. Data are represented as mean ± SD for (A), (B), and (D). (C) Western blotting for the proteins indicated in EGFP and Nanog KD ESCs. (D) ChIP in p400, Tip60 or EGFP KD ESCs for tetra-acetylated histone H4 (H4ac) at genes indicated. IgG control qPCRs were near zero (Figure S12).

References

    1. Baillat D, Hakimi MA, Naar AM, Shilatifard A, Cooch N, Shiekhattar R. Integrator, a multiprotein mediator of small nuclear RNA processing, associates with the C-terminal repeat of RNA polymerase II. Cell. 2005;123:265–276. - PubMed
    1. Bassing CH, Chua KF, Sekiguchi J, Suh H, Whitlow SR, Fleming JC, Monroe BC, Ciccone DN, Yan C, Vlasakova K, et al. Increased ionizing radiation sensitivity and genomic instability in the absence of histone H2AX. Proc. Natl. Acad. Sci. USA. 2002;99:8173–8178. - PMC - PubMed
    1. Benanti JA, Williams DK, Robinson KL, Ozer HL, Galloway DA. Induction of extracellular matrix-remodeling genes by the senescence-associated protein APA-1. Mol. Cell. Biol. 2002;22:7385–7397. - PMC - PubMed
    1. Bernstein BE, Mikkelsen TS, Xie X, Kamal M, Huebert DJ, Cuff J, Fry B, Meissner A, Wernig M, Plath K, et al. A bivalent chromatin structure marks key developmental genes in embryonic stem cells. Cell. 2006;125:315–326. - PubMed
    1. Boyer LA, Plath K, Zeitlinger J, Brambrink T, Medeiros LA, Lee TI, Levine SS, Wernig M, Tajonar A, Ray MK, et al. Polycomb complexes repress developmental regulators in murine embryonic stem cells. Nature. 2006;441:349–353. - PubMed

Publication types

Associated data