. 2008 Jul 11;31(1):21-32.
doi: 10.1016/j.molcel.2008.04.028.

Chk2 suppresses the oncogenic potential of DNA replication-associated DNA damage

Affiliations

Chk2 suppresses the oncogenic potential of DNA replication-associated DNA damage

Travis H Stracker et al. Mol Cell. .

Erratum in

  • Mol Cell. 2008 Dec 26;32(6):889

Abstract

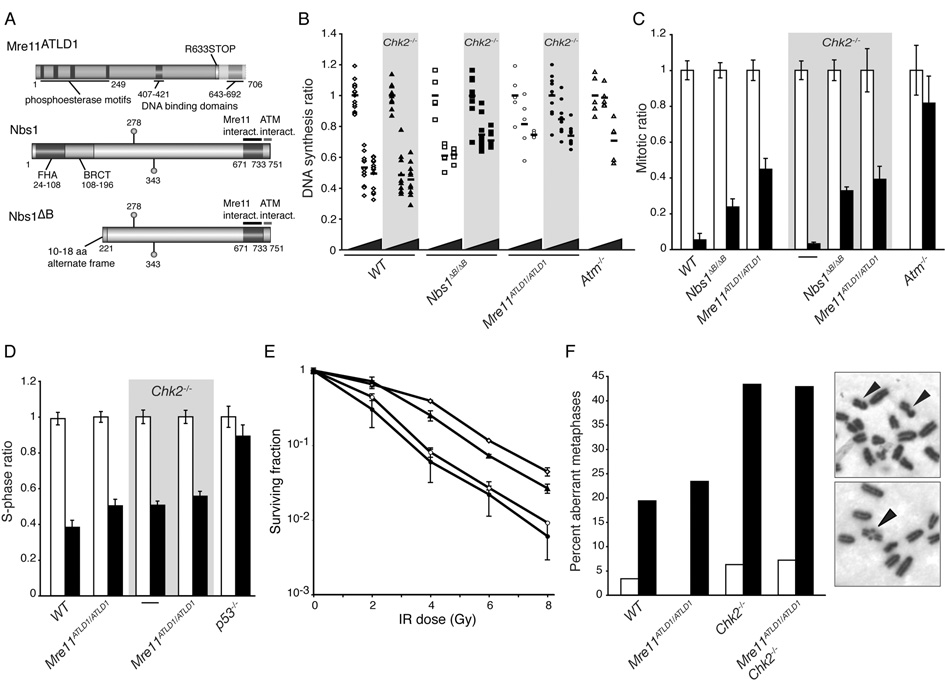
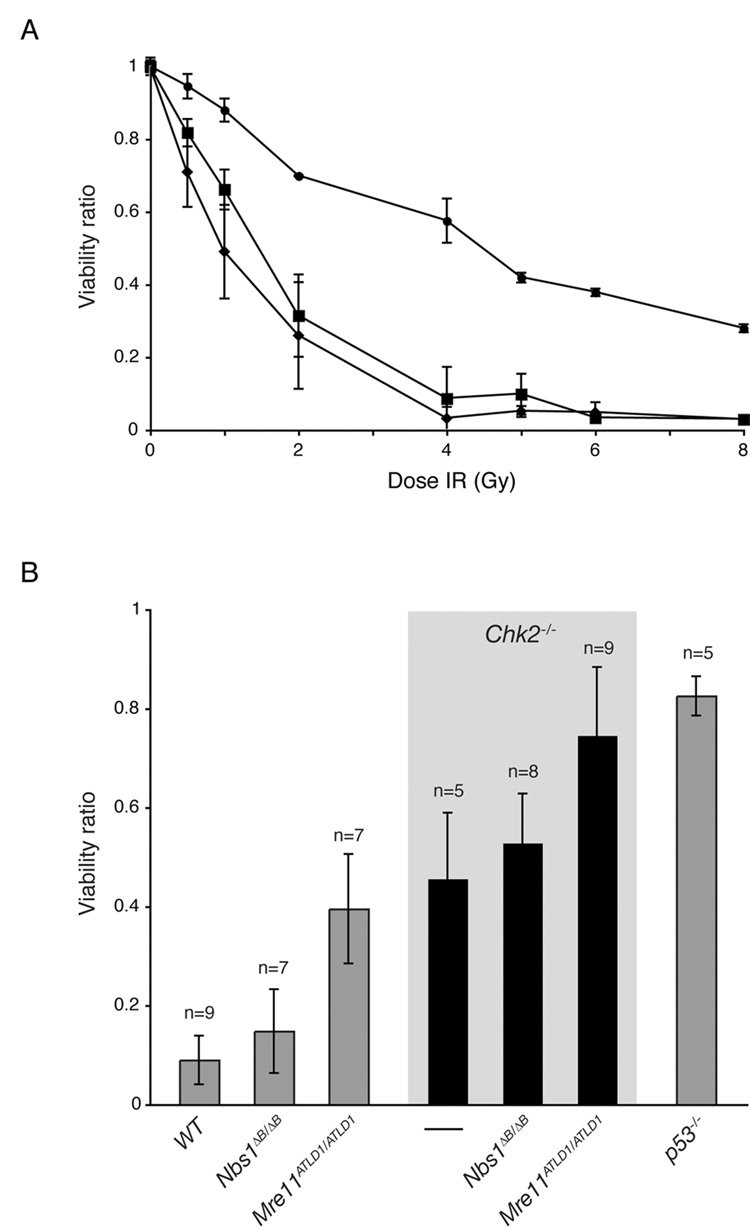
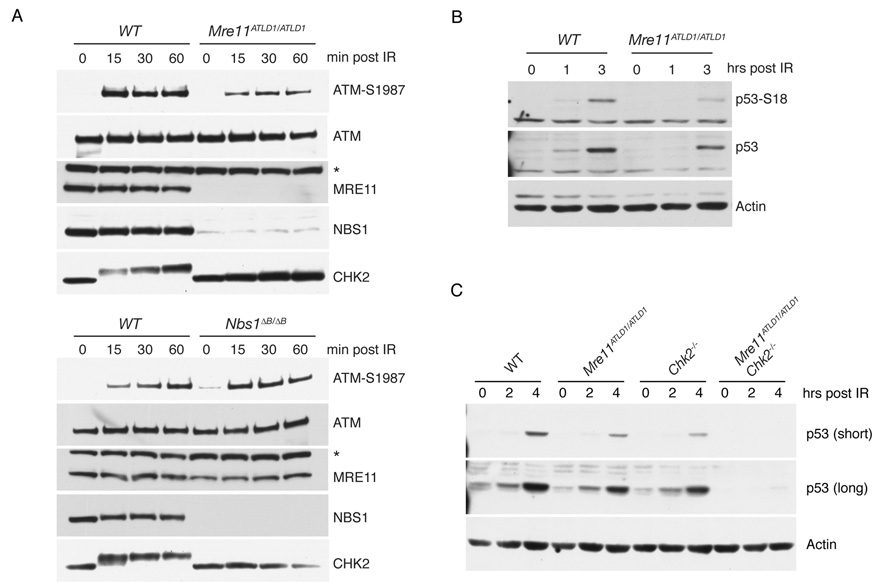
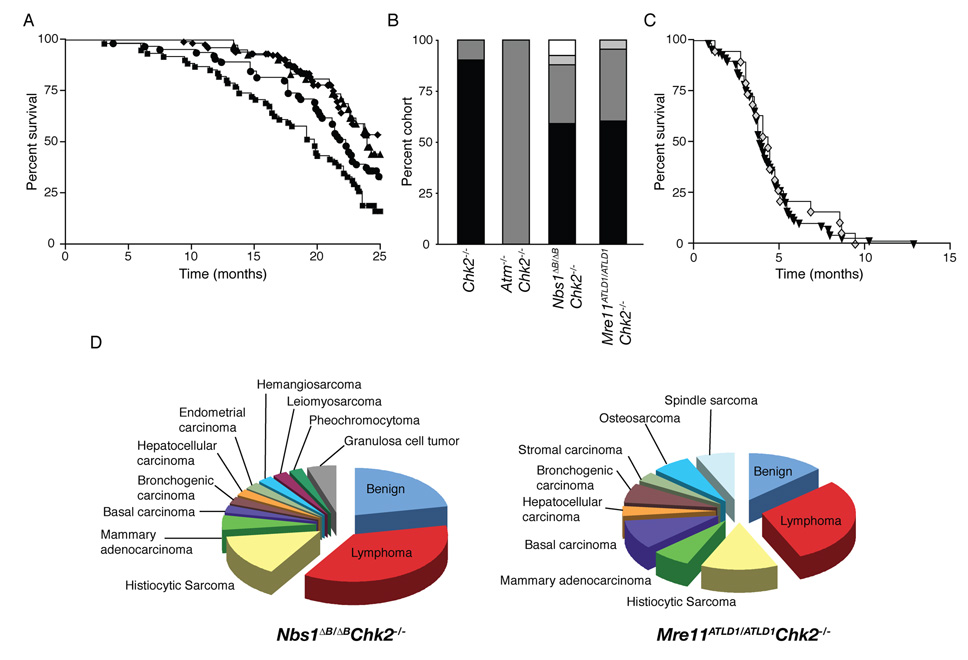
The Mre11 complex (Mre11, Rad50, and Nbs1) and Chk2 have been implicated in the DNA-damage response, an inducible process required for the suppression of malignancy. The Mre11 complex is predominantly required for repair and checkpoint activation in S phase, whereas Chk2 governs apoptosis. We examined the relationship between the Mre11 complex and Chk2 in the DNA-damage response via the establishment of Nbs1(DeltaB/DeltaB) Chk2(-/-) and Mre11(ATLD1/ATLD1) Chk2(-/-) mice. Chk2 deficiency did not modify the checkpoint defects or chromosomal instability of Mre11 complex mutants; however, the double-mutant mice exhibited synergistic defects in DNA-damage-induced p53 regulation and apoptosis. Nbs1(DeltaB/DeltaB) Chk2(-/-) and Mre11(ATLD1/ATLD1) Chk2(-/-) mice were also predisposed to tumors. In contrast, DNA-PKcs-deficient mice, in which G1-specific chromosome breaks are present, did not exhibit synergy with Chk2(-/-) mutants. These data suggest that Chk2 suppresses the oncogenic potential of DNA damage arising during S and G2 phases of the cell cycle.


Figures

Figure 1
Figure 1. Loss of Chk2 does not exacerbate the checkpoint defects, damage sensitivity, or chromosome instability conferred by Mre11 complex hypomorphism
(A) Diagram of the hypomorphic Mre11ATLD1 and Nbs1ΔB alleles (reviewed in Stracker et al., 2004). (B) Intra-S phase checkpoint response of WT (◇), Chk2−/− (◆), Nbs1ΔB/ΔB (□), Nbs1ΔB/ΔBChk2−/− (■), Mre11ATLD1/ATLD1 (○), Mre11ATLD1/ATLD1Chk2−/− (●) and Atm−/− (△) fibroblasts. The DNA synthesis ratios (untreated and IR treated cultures, normalized to untreated samples) are plotted. Wedge denotes increasing IR dose (0, 10, or 20 Gy) and horizontal bars indicate the average value of replicate experiments. Chk2−/− cultures are not significantly different than WT (P=0.33 at 10 and 0.82 at 20 Gy, WT vs. Chk2−/−) and loss of Chk2 does not exacerbate the defect of Mre11ATLD1/ATLD1 (P=0.88 at 10 and 0.55 at 20 Gy, Mre11ATLD1/ATLD1 vs. Mre11ATLD1/ATLD1Chk2−/−). However, Nbs1ΔB/ΔBChk2−/− cultures showed increased RDS compared to Nbs1ΔB/ΔB (P=1.5×10⁻³ at 10 and 2.5×10⁻³ at 20 Gy, Nbs1ΔB/ΔB vs. Nbs1ΔB/ΔBChk2−/−). Wilcoxon rank sum test, 2-sided. (C) G2/M checkpoint responses of exponentially growing MEFs. The mitotic ratios (mock or IR treated normalized to mock treated) of mock (white) or 10 Gy IR (black) treated cells at 1 hr post treatment are presented. Results are the average of 3–6 experiments performed in triplicate for each genotype. Error bars denote standard deviation. (D) G1/S checkpoint in early passage MEF cultures. The S-phase ratios (%BrdU positive of irradiated or unirradiated/ average %BrdU positive unirradiated) are plotted. Results are the average of 2–4 experiments performed in triplicate for each genotype. Error bars denote standard deviation. (E) IR sensitivity determined by clonogenic survival assay. WT (◇), Chk2−/− (▲), Mre11ATLD1/ATLD1 (○), and Mre11ATLD1/ATLD1Chk2−/− (●) SV40 transformed MEF cultures were exposed to IR at the indicated doses and plated for colony formation. Results from 2 representative experiments performed in triplicate are shown. Error bars denote standard deviation. (F) Genomic instability in mock and irradiated primary proliferating splenocytes. Examples of metaphases from IR treated Mre11ATLD1/ATLD1 Chk2−/− spreads are shown: 2 chromatid breaks (top) and a rearrangement (bottom) are indicated. The number of spreads analyzed and aberrations identified are described in Supplementary Table S1.
Figure 2
Figure 2. The Mre11 complex and Chk2 regulate apoptosis in parallel pathways
(A) Apoptosis in irradiated WT (◆), Nbs1ΔB/ΔB (■), and Mre11ATLD1/ATLD1 (●) thymocytes 20 hours post exposure to the indicated IR dose. Viability ratios are plotted for each dose (%viable cells mock or IR treated/ % viable cells mock treated). Triplicate results of 2 representative experiments are plotted. Error bars denote standard deviation. (B) Thymocytes from the indicated genotypes were mock treated or exposed to 5 Gy of IR in culture and analyzed 20 hours post treatment. Viability ratios are plotted for each dose and experiments were performed in triplicate with n indicating the number of animals represented and error bars denoting standard deviation. The viability ratio differences between Nbs1ΔB/ΔB and WT, or Chk2−/− and Nbs1ΔB/ΔB Chk2−/− are not statistically significant (Wilcoxon rank sum test, 2-sided).
Figure 3
Figure 3. The Mre11 complex and Chk2 regulate p53 in parallel pathways
(A) Western blot of thymocyte lysates from the indicated genotypes. Membranes were probed with antibodies for ATM-S1981, ATM, Nbs1, Mre11, and Chk2 at various times following 5 Gy of IR treatement. A non-specific band is indicated by *. (B) Western blot of thymocyte lysates probed with antibodies for p53-S18, p53 and Actin (loading control) at the indicated times following 5 Gy of IR. (C) Western blot of thymocyte lysates probed for p53 or Actin (loading control) at the indicated times post 5 Gy of IR.
Figure 4
Figure 4. The Mre11 complex-ATM and Chk2 regulate global p53 transcriptional responses
(A) Quantitative PCR analysis of p53 target genes Bbc3/Puma and Bax. Thymocytes were harvested 8 hours after exposure to 5 Gy of IR. Representative experiments performed in triplicate are shown: mock (white) or IR treated (black). (B) Analysis of microarray data for the indicated genotypes. 2338 probe sets showed statistically significant expression changes following IR treatment in WT thymocytes. No changes were significant in Chk2−/− and only 15 in Atm−/− (listed in Supplementary Table S2). The number of common genes altered in both WT and Atm−/− are indicated by the Venn diagram (GEO accession number pending). (C) Transcriptional regulation of genes involved in the cell cycle and apoptosis are impaired in both Atm−/− and Chk2−/− thymocytes. The heatmap indicates the induction (red) or repression (green) of selected genes with known roles in cell cycle regulation or apoptosis following IR treatment. (D) Model of p53-dependent apoptotic signaling. The Mre11 complex is required for activation of ATM and this function is attenuated in Mre11ATLD1/ATLD1 thymocytes. While both ATM and the Mre11 complex influence Chk2 phosphorylation, the apoptotic defects of Mre11ATLD1/ATLD1 or Atm−/− are additive with loss of Chk2 indicating that they function through a largely parallel signaling pathway.
Figure 5
Figure 5. Nbs1ΔB/ΔB Chk2−/− and Mre11ATLD1/ATLD1 Chk2−/− double mutants are predisposed to tumorigenesis
(A) Cohort survival of WT, Mre11ATLD1ATLD1 and Nbs1ΔB/ΔB (*combined n=172, ◆), Chk2−/− (n=41, ▲), Nbs1ΔB/ΔB Chk2−/− (n=66, ■), and Mre11ATLD1ATLD1 Chk2−/− (n=67, ●) is shown on a Kaplan Meier curve. *Individual survival curves, tumor free survival curves, and statistical analysis are included in Supplemental Figure S5, S6, and Table S3. (B) Animals succumbing to tumors are shown as a percentage of their cohort: tumor free (black), 1 tumor (dark gray), 2 tumors (light gray), more than 2 tumors (white). (C) Survival of Atm−/− (n=71, ▼) and Atm−/− Chk2−/− (n=19, ◇) cohorts plotted on a Kaplan Meier curve. (D) The percentage of tumor bearing animals with a specific tumor type is plotted for the indicated genotypes.
Figure 6
Figure 6. Prkdcscid/scid Chk2−/− animals are not tumor prone
(A) Immunohistochemical staining of the spleen and lymph nodes of WT, Prkdcscid/scid and Prkdcscid/scid Chk2−/− mice. White pulp (WP) of the spleen is outlined in broken lines (top panels). Regions of WP are smaller and contain few lymphocytes in Prkdcscid/scid and Prkdcscid/scid Chk2−/−. B220 staining of B-cells in the spleen (middle panels) and lymph nodes (bottom panels). In Prkdcscid/scid and Prkdcscid/scid Chk2−/− mice, both tissues have few B220 positive cells compared to WT. (B) Survival of WT (◆, n=62), Chk2−/− (▲, n=41), and Prkdcscid/scid Chk2−/− (formula image
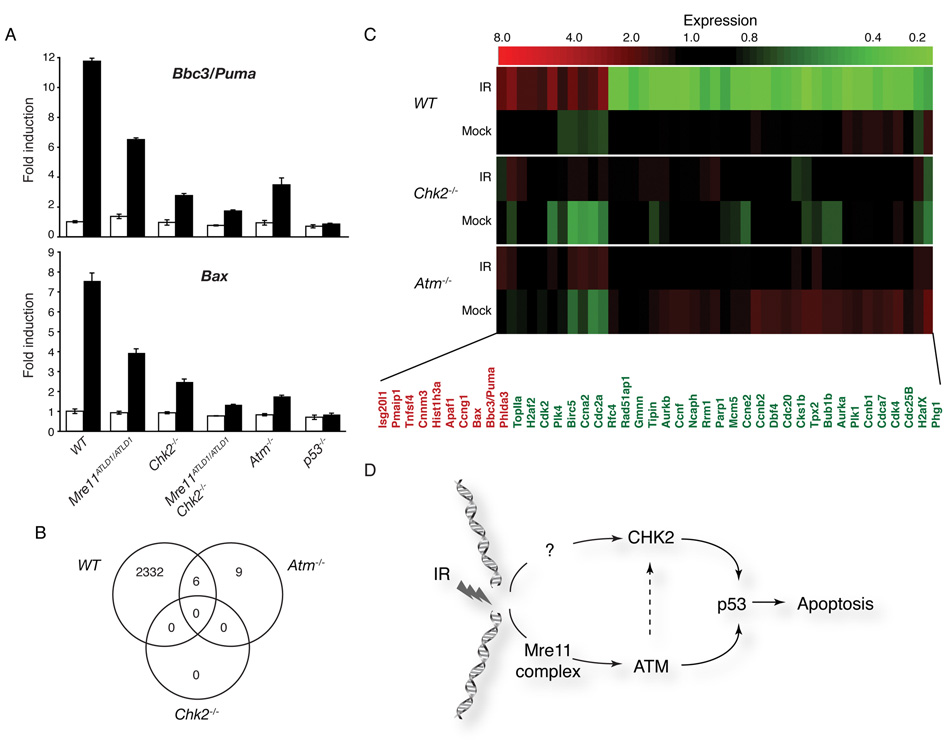
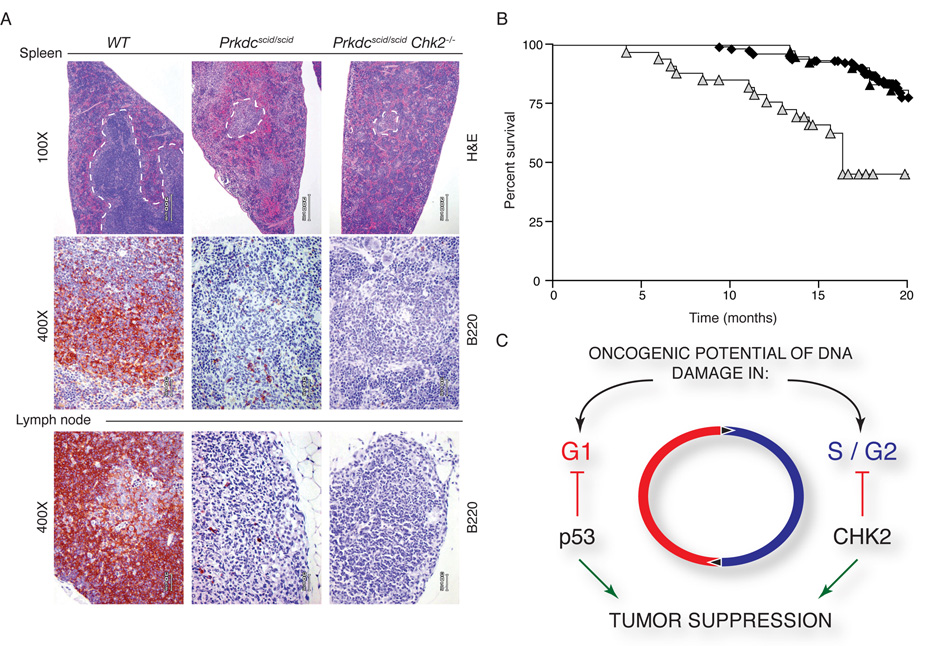
, n=34) is plotted on a Kaplan Meier curve. Survival of Prkdcscid/scid Chk2−/− animals was decreased due to infections and related pathology but no tumors were evident. (C) Model for the role of Chk2 in tumor suppression. Chk2 is required for suppressing the oncogenic potential of DNA-replication associated breaks, such as those arising in Nbs1ΔB/ΔB or Mre11ATLD1ATLD1 mutants, but not for breaks in G0/G1 phase cells resulting from defects associated with the Prkdcscid/scid mutation.

References

    1. Ahn JY, Schwarz JK, Piwnica-Worms H, Canman CE. Threonine 68 phosphorylation by ataxia telangiectasia mutated is required for efficient activation of Chk2 in response to ionizing radiation. Cancer Res. 2000;60:5934–5936. - PubMed
    1. Allen JB, Zhou Z, Siede W, Friedberg EC, Elledge SJ. The SAD1/RAD53 protein kinase controls multiple checkpoints and DNA damage-induced transcription in yeast. Genes & Dev. 1994;8:2401–2415. - PubMed
    1. Bahassi el M, Penner CG, Robbins SB, Tichy E, Feliciano E, Yin M, Liang L, Deng L, Tischfield JA, Stambrook PJ. The breast cancer susceptibility allele CHEK2* 1100delC promotes genomic instability in a knock-in mouse model. Mutat Res. 2007;616:201–209. - PubMed
    1. Bakkenist CJ, Kastan MB. DNA damage activates ATM through intermolecular autophosphorylation and dimer dissociation. Nature. 2003;421:499–506. - PubMed
    1. Barboza JA, Liu G, Ju Z, El-Naggar AK, Lozano G. p21 delays tumor onset by preservation of chromosomal stability. Proc Natl Acad Sci U S A. 2006;103:19842–19847. - PMC - PubMed

Publication types

MeSH terms

Associated data

LinkOut - more resources