. 2008 Sep;82(18):9094-106.
doi: 10.1128/JVI.00785-08. Epub 2008 Jul 9.

Epstein-Barr virus BART microRNAs are produced from a large intron prior to splicing

Affiliations

Epstein-Barr virus BART microRNAs are produced from a large intron prior to splicing

Rachel Hood Edwards et al. J Virol. 2008 Sep.

Abstract

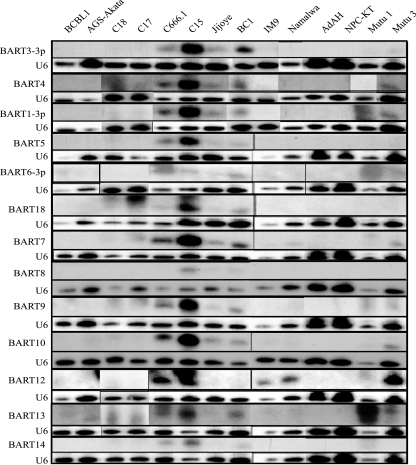
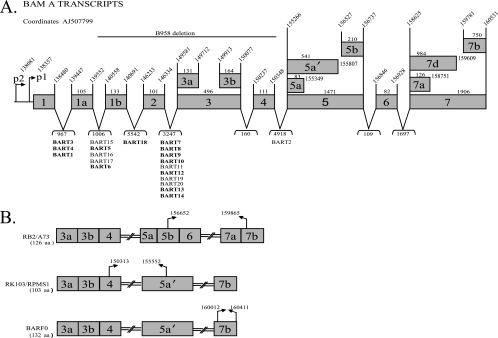
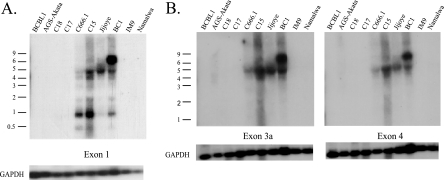
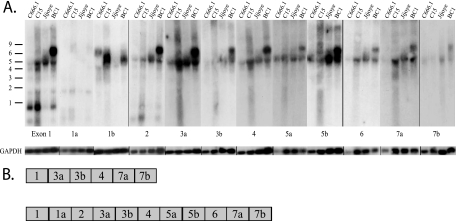
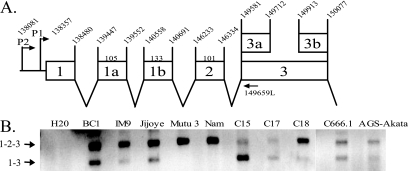
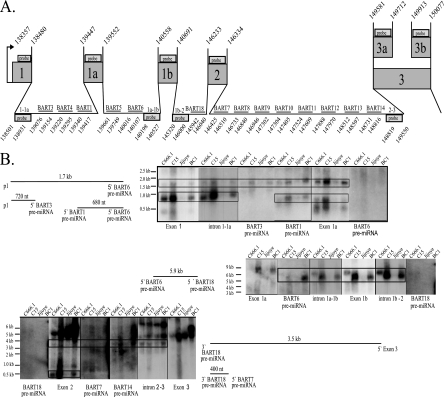
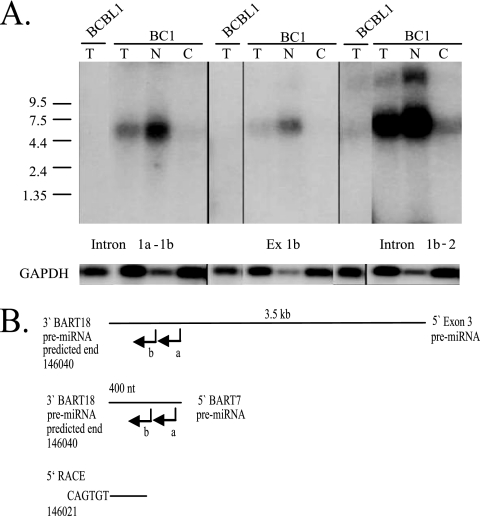
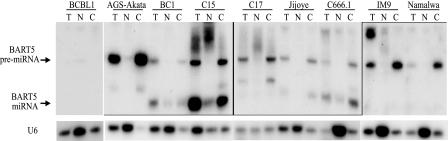
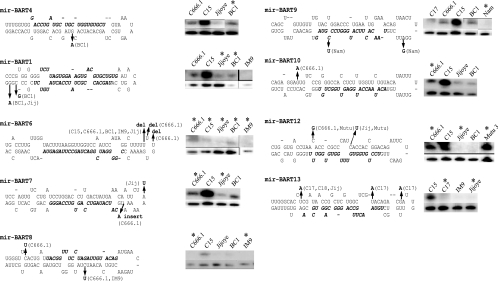
Latent Epstein-Barr virus (EBV) infection is associated with several lymphoproliferative disorders, including posttransplant lymphoma, Hodgkin's disease, and Burkitt's lymphoma, as well as nasopharyngeal carcinoma (NPC). Twenty-nine microRNAs (miRNAs) have been identified that are transcribed during latent infection from three clusters in the EBV genome. Two of the three clusters of miRNAs are made from the BamHI A rightward transcripts (BARTs), a set of alternatively spliced transcripts that are highly abundant in NPC but have not been shown to produce a detectable protein. This study indicates that while the BART miRNAs are located in the first four introns of the transcripts, processing of the pre-miRNAs from the primary transcript occurs prior to completion of the splicing reaction. Additionally, production of the BART miRNAs correlates with accumulation of a spliced mRNA in which exon 1 is joined directly to exon 3, suggesting that this form of the transcript may favor production of miRNAs. Sequence variations and processing of pre-miRNAs to the mature form also may account for various differences in miRNA abundance. Importantly, residual intronic pieces that result from processing of the pre-miRNAs were detected in the nucleus. The predicted structures of these pieces suggest there is a bias or temporal pattern to the production of the individual pre-miRNAs. These findings indicate that multiple factors contribute to the production of the BART miRNAs and to the apparent differences in abundance between the individual miRNAs of the cluster.


Figures

FIG. 1.
FIG. 1.
Analysis of the BART miRNA expression in the tumor-derived cells and cell lines. Shown is Northern analysis of selected EBV BART miRNAs in total RNA samples derived from the indicated cell lines and tumors. The BCBL1 cell line served as the negative control, and U6 RNA served as a loading control.
FIG. 2.
FIG. 2.
Structure of the EBV BARTs and the genomic location of the BART miRNAs. (A) Schematic of the promoter, exon, and intron structures of composite BART cDNAs cloned from the xenograph C15 with the corresponding EBV coordinates (AJ507799) and the location of the BART miRNAs. The boldface miRNAs were analyzed in this study. The bp sizes of exons and introns are noted. (B) Putative proteins encoded by the ORFs of the BART cDNAs with the positions of the start and stop codons indicated and the amino acid length of each ORF.
FIG. 3.
FIG. 3.
Analysis of the BART mRNA expression and 5′ structure in tumor-derived cells and cell lines. (A) Total RNA samples from the indicated cell lines and tumors were hybridized to an antisense riboprobe to exon 1. GAPDH mRNA expression was used as a loading control. Size markers are indicated. (B) Total RNA samples were hybridized to antisense riboprobes to exons 3a and 4. GAPDH mRNA expression was used as a loading control. Size markers are indicated.
FIG. 4.
FIG. 4.
Variation in the BART mRNA structure. (A) Total RNA samples were hybridized to antisense riboprobes to the BamHI A exons. GAPDH mRNA expression was used as a loading control. Size markers are indicated. (B) Structure of full-length cDNAs cloned from the xenograph C15.
FIG. 5.
FIG. 5.
Differential splicing at the 5′ end of the mRNAs in tumor-derived cells. (A) Schematic of the promoter and exons of the 5′ end of the BART mRNA with the genomic coordinates noted. (B) RT-PCR analysis using primers specific for P1 and exon 3. The splicing structures of the products are denoted from sequencing the gel-purified bands.
FIG. 6.
FIG. 6.
Detection of stable intronic RNA structures after miRNA processing. (A) Schematic of the 5′ BART region with the genomic coordinates of the exons, introns, BART pre-miRNAs, and probes used in the Northern analysis. The exon and intron probes are indicated by boxes with the 5′ and 3′ coordinates denoted. The pre-miRNA probes are indicated by horizontal lines with the 5′ and 3′ ends denoted. (B) Northern analysis and diagrams of the potential stable RNA structures in the tumor-derived cell lines resulting from miRNA processing. Total RNA was hybridized to antisense riboprobes representing exons, introns, and pre-miRNAs. Size markers are noted. The sizes and projected endpoints of the stable RNA structures are shown.
FIG. 7.
FIG. 7.
Detection of the stable intronic RNA in fractionated BC1 cells and determination of the 5′ end of stable RNAs after miRNA processing. (A) Detection of stable intronic RNA in nuclear RNA. The BC1 cell line was separated into nuclear and cytoplasmic fractions. Northern blots were prepared with total (T), nuclear (N), and cytoplasmic (C) RNA and probed with antisense riboprobes representing introns and exon 1b. An antisense riboprobe to GAPDH mRNA was used as an indicator of fraction purity as well as a loading control. Size markers are noted. BCBL1 RNA was used as a negative control. (B) 5′ RACE of the stable 400-nt and 3.5-kb RNAs identified in Fig. 6B. Leftward intron-specific primer (a) was used to prime cDNA synthesis. cDNA was tagged with oligo(dT) and amplified using an oligo(dT) adapter primer and the nested leftward intron-specific primer (b).
FIG. 8.
FIG. 8.
Impaired processing of the BART5 miRNA. Northern analysis of the BART5 miRNA in total, nuclear, and cytosolic RNA samples from the indicated tumor-derived cells and cell lines and the detection of the pre-miRNA and the processed miRNA forms. The nuclear U6 RNA was used as a loading control as well as an indicator of cell fraction integrity.
FIG. 9.
FIG. 9.
Sequence variation within the BART miRNAs (mir-BART) and analysis of miRNA expression. The sequence of the BART pre-miRNAs is shown with the mature miRNA indicated in italics. Sequence changes are denoted in boldface with the corresponding cell line indicated. Expression of the miRNA in cell lines with and without sequence changes was determined by Northern blotting and is shown in the top band. Hybridization to the small nuclear U6 RNA is included as a loading control and is shown in the lower band. Asterisks denote cell lines with sequence changes.

References

    1. Brooks, L. A., A. L. Lear, L. S. Young, and A. B. Rickinson. 1993. Transcripts from the Epstein-Barr virus BamHI A fragment are detectable in all three forms of virus latency. J. Virol. 673182-3190. - PMC - PubMed
    1. Buck, A. H., J. Santoyo-Lopez, K. A. Robertson, D. S. Kumar, M. Reczko, and P. Ghazal. 2007. Discrete clusters of virus-encoded microRNAs are associated with complementary strands of the genome and the 7.2-kilobase stable intron in murine cytomegalovirus. J. Virol. 8113761-13770. - PMC - PubMed
    1. Busson, P., G. Ganem, P. Flores, F. Mugneret, B. Clausse, B. Caillou, K. Braham, H. Wakasugi, M. Lipinski, and T. Tursz. 1988. Establishment and characterization of three transplantable EBV-containing nasopharyngeal carcinomas. Int. J. Cancer 42599-606. - PubMed
    1. Busson, P., R. McCoy, R. Sadler, K. Gilligan, T. Tursz, and N. Raab-Traub. 1992. Consistent transcription of the Epstein-Barr virus LMP2 gene in nasopharyngeal carcinoma. J. Virol. 663257-3262. - PMC - PubMed
    1. Cai, X., and B. R. Cullen. 2006. Transcriptional origin of Kaposi's sarcoma-associated herpesvirus microRNAs. J. Virol. 802234-2242. - PMC - PubMed

Publication types

LinkOut - more resources