. 2008 Sep 1;510(1):100-16.
doi: 10.1002/cne.21782.

Contralateral corticothalamic projections from MI whisker cortex: potential route for modulating hemispheric interactions

Affiliations

Contralateral corticothalamic projections from MI whisker cortex: potential route for modulating hemispheric interactions

Kevin D Alloway et al. J Comp Neurol. .

Abstract

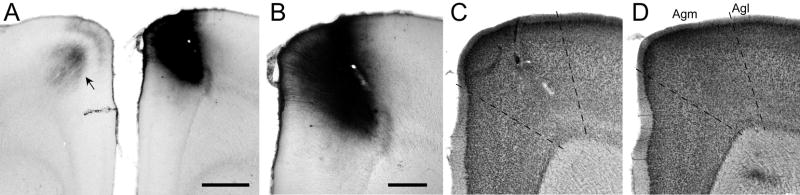
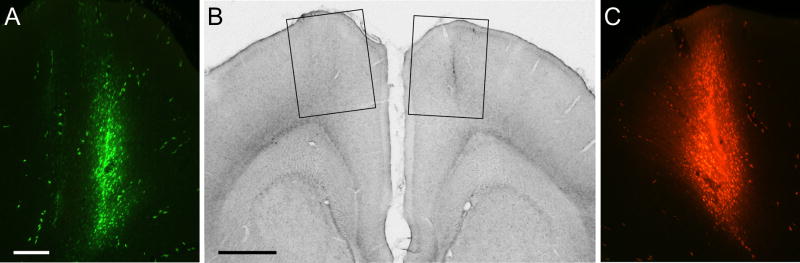
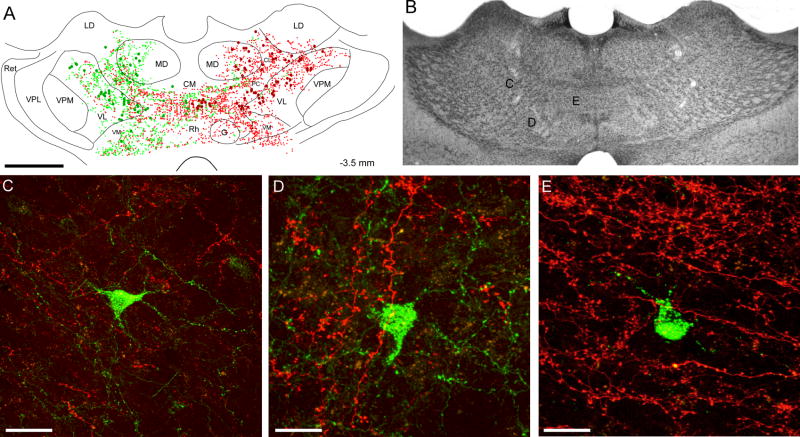
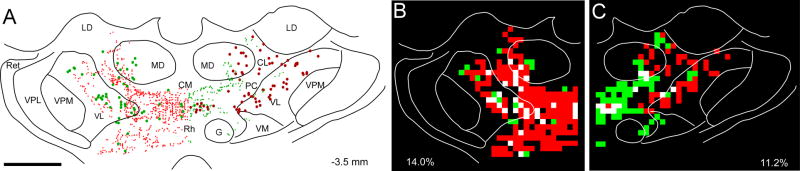
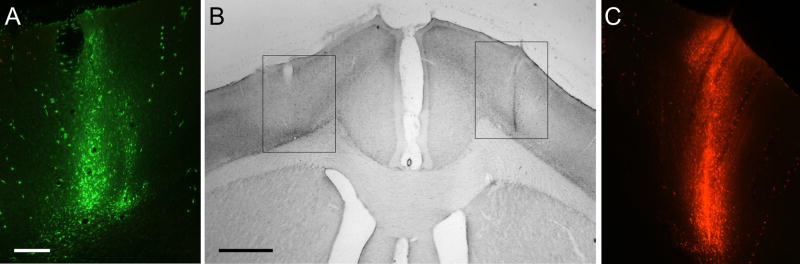
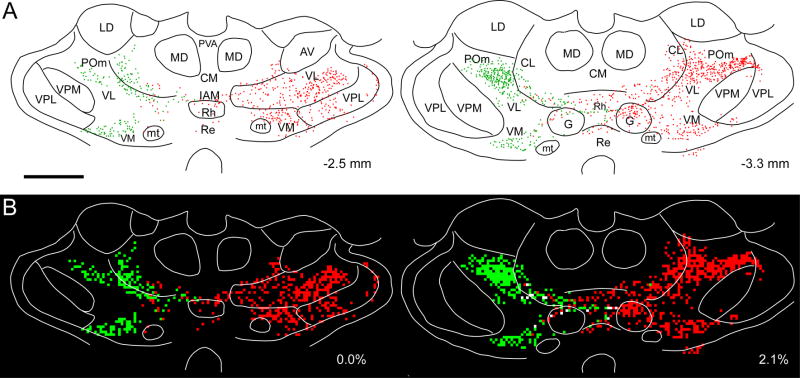
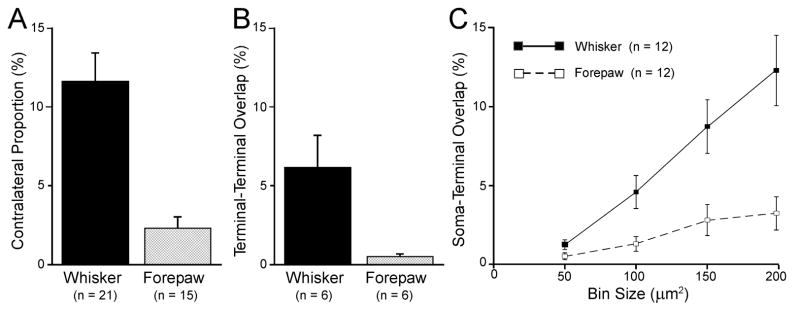
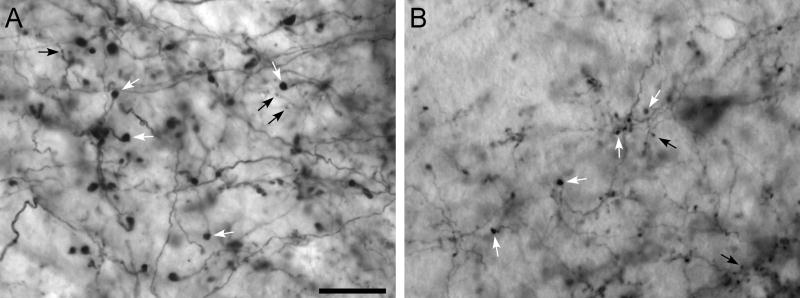
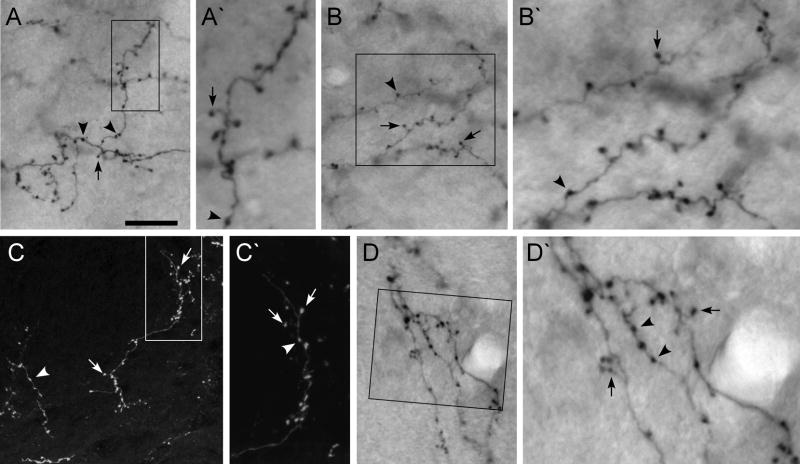
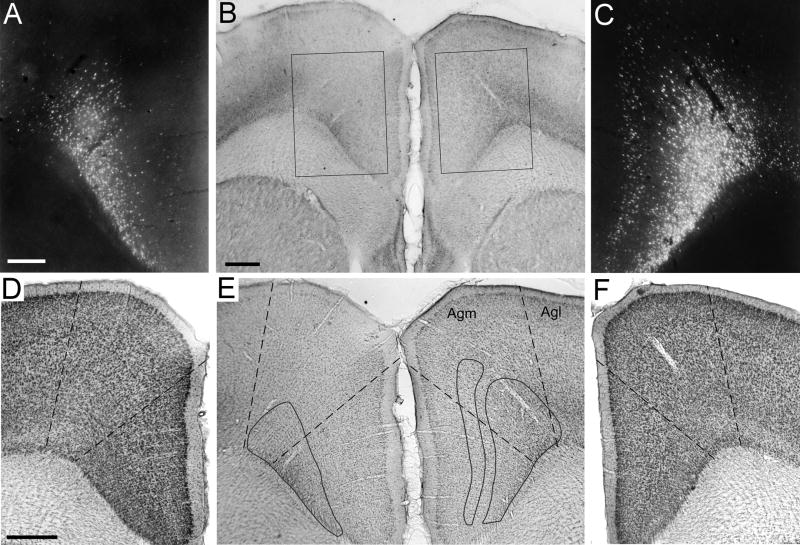
Rat whisking behavior is characterized by high amounts of bilateral coordination in which whisker movements on both sides of the face are linked. To elucidate the neural substrate that might mediate this bilateral coordination, neuronal tracers were used to characterize the bilateral distribution of corticothalamic projections from primary motor (MI) cortex. Some rats received tracers in the MI whisker region, whereas others received tracers in the MI forepaw region. The MI whisker region projects bilaterally to the anteromedial (AM), ventromedial (VM), and ventrolateral (VL) nuclei, and to parts of the intralaminar nuclei. By contrast, the MI forepaw region sends virtually no projections to the contralateral thalamus. Consistent with these findings, bilateral injections of different tracers into the MI whisker region of each hemisphere produced tracer overlap on both sides of the thalamus. Furthermore, MI whisker projections to the contralateral thalamus terminate in close proximity to the thalamocortical neurons that project to the MI whisker region of that contralateral hemisphere. The terminal endings of the contralateral corticothalamic projections contain small synaptic varicosities and other features that resemble the modulator pathways described for other corticothalamic projection systems. In addition, tracer injections into AM, VM, and VL revealed dense clusters of labeled neurons in layer VI of the medial agranular (Agm) zone, which corresponds to the MI whisker region. These results suggest that projections from the MI whisker region to the contralateral thalamus may modulate the callosal interactions that are presumed to play a role in coordinating bilateral whisking behavior.


Figures

Fig 1
Fig 1
Location of a BDA deposit in the MI whisker region of rat BN27. A: Dense deposit of BDA at a site in the right hemisphere that evoked discrete twitches of whiskers D1, D2, and E2. Callosal projections from the BDA injection site terminated in the corresponding part of the left hemisphere (arrow). Scale, 1 mm. B: Magnified view of the BDA injection site. Scale, 500 μm. C: An adjacent thionin-stained section reveals slight damage produced by the tracer injection. D: Another thionin-stained section, located 160 μm caudal to the section in panel C, reveals the cytoarchitectonic distinctions between medial (Agm) and lateral (Agl) agranular cortex. Panels C and D shown at the same magnification as panel B.
Fig. 2
Fig. 2
Bilateral corticothalamic projections from the MI whisker region in rat BN27. A, B: Low power views of BDA-labeled terminals in the thalamus; panel B is 160 μm caudal to panel A. Rectangles in panels A and B indicate the regions in panels C and F, respectively. Scale, 1.0 mm; panels A and B at same magnification. C: Labeled terminals in AM, VL, and VM. Rectangles indicate photomicrographs appearing in panels D and E. Scale, 250 μm. D: Detailed view of labeled terminals in AM and the medial part of VL. Scale, 100 μm. E: Detailed view of labeled terminals in nucleus VM. Same magnification as panel D. F. Collage showing detailed view of BDA labeling in the ipsilateral thalamus. Arrows indicate retrogradely-labeled cells, all other regions of dense BDA labeling represent anterogradely-labeled terminals. Scale, 100 μm.
Fig. 3
Fig. 3
Bilateral injections of Alexa-Fluoro (AF) and Fluoro-Ruby (FR) into the MI whisker regions of rat BN11. A: View of the AF injection site in which ICMS evoked twitches of whisker B2. Scale, 250 μm. B: Location of the AF and FR tracer injection sites in the left and right hemispheres, respectively, as seen during light microscopy. Rectangles indicate the regions appearing in panels A and C during fluorescent microscopy. Scale, 1.0 mm. C: View of the FR injection site in which ICMS evoked twitches of whisker B1. Magnification same as panel A. A copy of the figure using magenta-green coloring is available as a supplementary figure.
Fig. 4
Fig. 4
Bilateral distribution of AF- and FR-labeled corticothalamic terminal projections from the MI whisker regions in rat BN11. A: Reconstructed coronal sections depict the boundaries of several thalamic nuclei with respect to terminal varicosities labeled by AF (green dots) or FR (red dots). The distance from bregma is shown at lower right for each section. B: Overlap analysis of the reconstructions shown in panel A. After subdividing the reconstructions into a grid of 50 μm2 bins, the bins are colored green and red according to the presence of AF- and FR-labeled varicosities. White bins indicate regions occupied by terminal projections from both MI tracer injections. Scale bar = 1 mm for both panels. A copy of the figure using magenta-green coloring is available as a supplementary figure.
Fig. 5
Fig. 5
Bilateral distribution of AF- and FR- labeled terminals and soma in rat BN11. A: Reconstruction of labeled terminals (small dots) and cell bodies (large filled circles) in a coronal section located halfway between the coronal sections appearing in Fig. 4. Scale, 1 mm. B: Thionin-stained section located adjacent to the section reconstructed in panel A. Letters indicate the approximate location of the regions shown in panels C, D, and E. Same scale as in panel A. C, D, E: FR-labeled corticothalamic projections from the right MI whisker region are intermingled with AF-labeled thalamocortical neurons that project to the left MI whisker region. Scale bars, 40 μm in panel C, 20 μm in panels D and E. A copy of the figure using magenta-green coloring is available as a supplementary figure.
Fig. 6
Fig. 6
Proximity of labeled corticothalamic projections with respect to thalamocortical neurons labeled by the other tracer. A. Reconstruction of labeled corticothalamic terminals in the contralateral thalamus shown with respect to retrogradely-labeled soma in case BN11. Only contralaterally-labeled corticothalamic projections are shown, the locations of the ipsilaterally-labeled corticothalamic projections have been removed. Scale, 1 mm. B. Overlap analysis of FR-labeled terminals and AF-labeled neurons after subdividing the left half of the thalamic reconstruction into an array of 100 μm2 bins. Green bins contain AF-labeled neurons, red bins contain AF-labeled terminals, white bins contain both neurons and terminals. Percentage indicates the proportion of labeled bins that are white. C. Overlap analysis of AF-labeled terminals and FR-labeled neurons in the right half of the same thalamic section shown in panel A. A copy of the figure using magenta-green coloring is available as a supplementary figure.
Fig. 7
Fig. 7
Bilateral injections of Alexa-Fluoro (AF) and Fluoro-Ruby (FR) into the MI forepaw regions of rat BN16. A: View of the AF injection site in which ICMS evoked twitches of the right forepaw. Scale, 250 μm. B: Location of the AF and FR tracer injection sites in the left and right hemispheres, respectively, as seen during light microscopy. Rectangles indicate the regions appearing in panels A and C during fluorescent microscopy. Scale, 1.0 mm. C: View of the FR injection site in which ICMS evoked twitches of the left forepaw. Magnification same as panel A. A copy of the figure using magenta-green coloring is available as a supplementary figure.
Fig. 8
Fig. 8
Bilateral distribution of AF- and FR-labeled corticothalamic terminal projections from the MI forepaw regions in rat BN16. Reconstructions of the labeling patterns (A) and the corresponding overlap analysis (B) are presented as in Figure 4. Scale bar = 1 mm for both panels. A copy of the figure using magenta-green coloring is available as a supplementary figure.
Fig. 9
Fig. 9
Quantitative analysis of corticothalamic projections from the whisker and forepaw regions in MI. A: Proportion of corticothalamic labeling that occupied the side of the thalamus located contralateral to the tracer injection in MI. Data based on the number of 50 μm2 bins that contained labeled varicosities (see Methods). B: Amount of tracer overlap in thalamus following bilateral injections of different tracers into MI of each hemisphere. Data based on the number of 50 μm2 bins that contained both AF- and FR-labeled terminals. C: Amount of tracer overlap on each side of the thalamus in which a labeled terminal occupied the same bin that contained a soma labeled by the other tracer.
Fig. 10
Fig. 10
Comparison of BDA-labeled corticothalamic projections from SI and MI to the ipsilateral nucleus POm. A: Labeled terminals in the ipsilateral Pom after injecting BDA into SI barrel cortex. Black arrows indicate small, modulator terminals; white arrows indicate large, driver terminals. Scale, 25 μm. B: Labeled terminals in the ipsilateral POm after injecting BDA into the MI whisker region. Arrows and scale are presented as in panel A.
Fig. 11
Fig. 11
Comparison of labeled terminal projections from MI to the contralateral thalamus. A, A′: BDA-labeled terminals in the contralateral nucleus AM. B, B′: BDA-labeled terminals in the contralateral nucleus VL. C, C′: FR-labeled terminals in the contralateral nucleus VM. D, D′: BDA-labeled terminals in the contralateral nucleus VM. Arrows indicate “drumstick-shaped” varicosites and arrowheads indicate “beaded enlargements.” Rectangles in panels A, B, C and D, indicate regions depicted at higher magnification in panels A′, B′, C′, and D′. Scale bar represents 25 μm for panels A, B, C, and D, but represents 10 μm for panels A′, B′, C′, and D′.
Fig. 12
Fig. 12
Thalamic labeling produced by depositing fluoro-gold (FG) into nuclei AV, AM, VM, and VL. A: Location of FG injection site 2 mm posterior to bregma. Scale, 500 μm; panels A and B at same magnification. B: Section in panel A viewed during fluorescent microscopy, rectangle indicates region in panel C. C: Neurons retrogradely labeled by FG appear along midline ipsilateral to the FG injection site but were not apparent in the contralateral thalamus except for a small number in the zona incerta (arrow). Scale, 250 μm. D: Thionin stained section through rostral part of the reticular nucleus. Scale, 1 mm. E: Adjacent unstained section shows magnified view of rostral reticular nucleus. Rectangle and dashed contour indicate regions appearing in panel F. Scale, 500 μm. F: Section in panel E viewed during fluorescent microscopy shows cluster of FG-labeled neurons in the reticular nucleus. Scale, 250 μm.
Fig. 13
Fig. 13
Labeled neurons in MI cortex produced by a deposit of FG in the right thalamus. A: Retrogradely-labeled neurons in deep layer VI of the contralateral MI cortex. Scale, 250 μm. B: Unstained section through the left and right MI cortices; rectangles indicate the regions shown in panels A and C. Scale, 500 μm. C: Retrogradely labeled neurons in layers Vb and VI of the ipsilateral MI cortex. Same magnification as panel A. D: Thionin-stained section through left MI cortex located adjacent to the section in panel A. Dashed lines indicate the borders of the medial agranular (Agm) cortex. Scale, 500 μm. E: Same section as in panel B but shown at magnification used for panels D and F. Solid contours show locations of retrogradely-labeled neurons after superimposing the fluorescent photomicrographs in A and C onto the section. Dashed lines show approximate Agm borders after superimposing the thionin-stained sections in panels D and F onto the section. F: Thionin-stained section through right MI cortex located adjacent to the section in panel C. Dashed lines and magnification are shown as in panel D.

References

    1. Aggleton JP, Hunt PR, Nagle S, Neave N. The effects of selective lesions within the anterior thalamic nuclei on spatial memory in the rat. Behav Brain Res. 1996;81:189–198. - PubMed
    1. Aggleton JP, Brown MW. Episodic memory, amnesia, and the hippocampal-anterior thalamic axis. Behav Brain Sci. 1999;22:425–444. - PubMed
    1. Aldes LD. Thalamic connectivity of rat somatic motor cortex. Brain Res Bull. 1988;20:333–348. - PubMed
    1. Alloway KD, Hoffer ZS, Hoover JE. Quantitative comparisons of the topographic organization in the ventrobasal complex and posterior nucleus of the rodent thalamus. Brain Res. 2003;968:54–68. - PubMed
    1. Alloway KD, Mutic JJ, Hoover JE. Divergent corticostriatal projections from a single cortical column in the somatosensory cortex of rats. Brain Res. 1998;785:341–346. - PubMed

Publication types