. 2008 Sep;73(9):847-56.
doi: 10.1002/cyto.a.20600.

Development of an automated analysis system for data from flow cytometric intracellular cytokine staining assays from clinical vaccine trials

Affiliations

Development of an automated analysis system for data from flow cytometric intracellular cytokine staining assays from clinical vaccine trials

Nicholas Shulman et al. Cytometry A. 2008 Sep.

Abstract

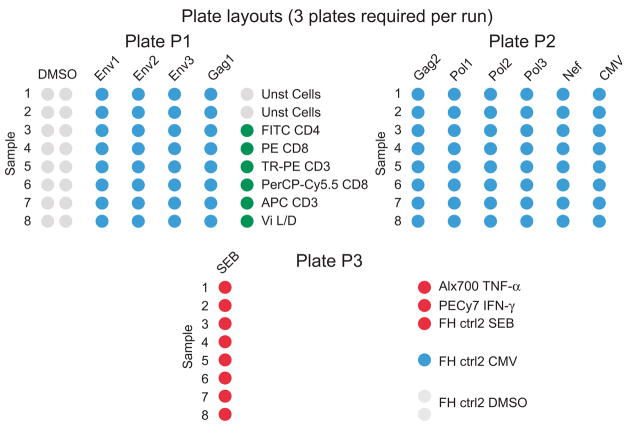
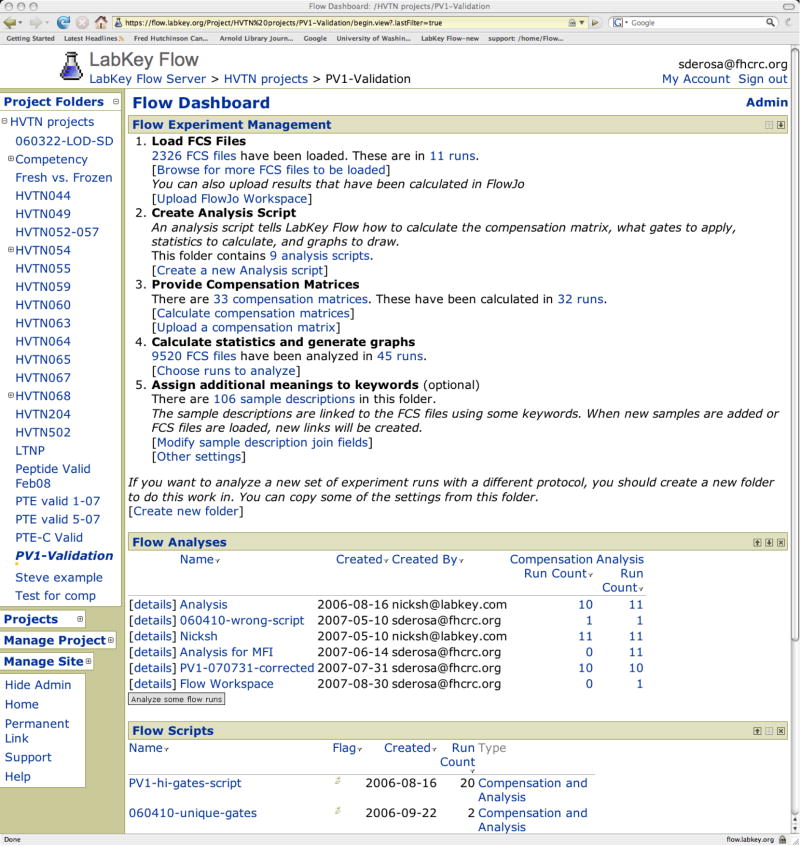
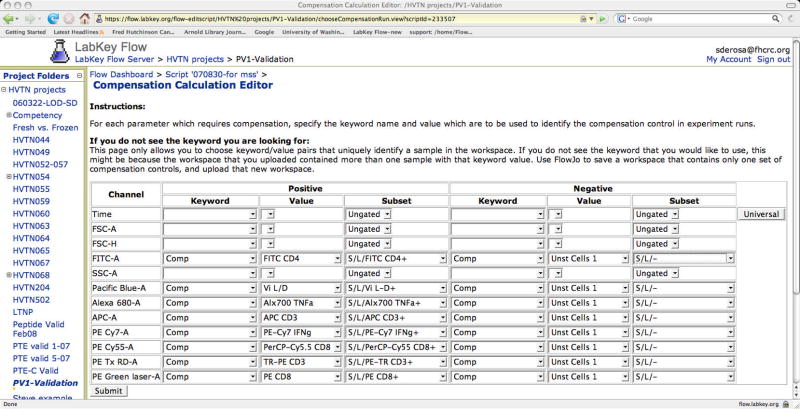
Intracellular cytokine staining (ICS) by multiparameter flow cytometry is one of the primary methods for determining T-cell immunogenicity in HIV-1 clinical vaccine trials. Data analysis requires considerable expertise and time. The amount of data is quickly increasing as more and larger trials are performed, and thus there is a critical need for high-throughput methods of data analysis. A web-based flow cytometric analysis system, LabKey Flow, was developed for the analyses of data from standardized ICS assays. Using a gating template created manually in commercially available flow cytometric analysis software, the system automatically compensates and analyzes all data sets. Quality control queries were designed to identify potentially incorrect sample collections. Comparison of the semiautomated analysis performed by LabKey Flow and the manual analysis performed using FlowJo software demonstrated excellent concordance (concordance correlation coefficient > 0.990). Manual inspection of the analyses performed by LabKey Flow for eight-color ICS data files from several clinical vaccine trials indicated that template gates can appropriately be used for most data sets. Thus, the semiautomated LabKey Flow analysis system can accurately analyze large ICS data files. Routine use of the system does not require specialized expertise. This high-throughput analysis will provide great utility for rapid evaluation of complex multiparameter flow cytometric measurements collected from large clinical trials.


Figures

Figure 1
Figure 1
Plate layout used for 8-color ICS assay. For the ICS assay used within the HVTN, each row on a plate is a different sample, labeled by number and identified by the keyword “sample order” in the collection template. Each column or set of columns is a different stimulation condition, such as DMSO indicating the negative control (cells cultured with the diluent for the peptide pools, DMSO, but no antigen specific stimulant). The wells stimulated with the positive control, SEB, are included on a separate plate to avoid potential contamination of the test wells. Before collection on the flow cytometer, PBS is added to the empty columns between stimulation conditions to reduce carry-over as the samples are sequentially collected. A PBMC sample with a known response to CMV (the FH ctrl2) is included in each experiment and is included on plate 3. Most compensation samples are included in one column on plate 1. Compensation samples that require stimulation with SEB are included on the plate with the other SEB-stimulated wells (plate 3).
Figure 2
Figure 2
Overview of LabKey Flow. The diagram illustrates the key features of LabKey Flow. Items indicated in gray boxes are external to the system and can be imported. Ovals represent function performed by the system. Clear boxes represent items created by or output from the system.
Figure 3
Figure 3
Home web page for a study. The starting web page for a study is referred to as the Flow Dashboard. The first section, Experiment Management, includes 5 parts referring to the main functional features of the system. The second section, Flow Analyses, list analysis folders. The same FCS file cannot be analyzed more than once within an analysis folder; however, the same FCS file can be analyzed in different folders, e.g., using different analysis scripts. Within an analysis folder, all experiments may be analyzed using a single analysis script. Alternatively, different analysis scripts may be used for different experiments, e.g., if one experiment requires specialized gating. Results of analyses are viewed by selecting an analysis folder. The third section, Flow Analysis Scripts, lists analyses scripts.
Figure 4
Figure 4
The compensation editor. This figure shows the web page used to define the compensation analysis script. Each parameter included in the FCS files is listed. One column allows the user to choose which keyword contains the compensation sample label. Another column allows the user to choose the value of that keyword for that particular compensation sample. A third column allows the user to choose which of the predefined gates for that sample to use as the positive population for the purpose of compensation calculation. On the right side of the window, individually identifying negative populations for each sample is possible. Alternatively, one sample may be chosen and the negative population from that sample used for all the compensations samples (i.e., a universal negative).
Figure 5
Figure 5
View of analysis results. Shown is an example of a view of analysis results. These views are customized by the user. In this view, four plots are shown. The first shows lymphocytes and indicates the CD3+ gate, the second shows CD3+ cells and indicates the CD4+ and CD8+ gates. The third and fourth show the CD4+ and CD8+ cells indicating the gate for IFN-γ+ cells. Only SEB-stimulated samples are listed.
Figure 6
Figure 6
Comparison of cell counts as determined by FlowJo and by LabKey Flow. The number of CD3+ T cells as determined by FlowJo (x-axis) correlate with the number of cells as determined by LabKey Flow (y-axis) for analysis of ICS data from PBMC samples from 41 adult individuals (left graph). The right graph shows this correlation for CD4+ T cells producing both IFN-γ and IL-2 in response to stimulation with SEB.

Comment in

  • Infinite multidimensionality.
    Tárnok A. Tárnok A. Cytometry A. 2008 Sep;73(9):777-8. doi: 10.1002/cyto.a.20625. Cytometry A. 2008. PMID: 18756513 No abstract available.

References

    1. Russell ND, Hudgens MG, Ha R, Havenar-Daughton C, McElrath MJ. Moving to human immunodeficiency virus type 1 vaccine efficacy trials: defining T cell responses as potential correlates of immunity. J Infect Dis. 2003;187(2):226–42. - PubMed
    1. Horton H, Thomas EP, Stucky JA, Frank I, Moodie Z, Huang Y, Chiu YL, McElrath MJ, De Rosa SC. Optimization and validation of an 8-color intracellular cytokine staining (ICS) assay to quantify antigen-specific T cells induced by vaccination. J Immunol Methods. 2007;323(1):39–54. - PMC - PubMed
    1. Li F, Malhotra U, Gilbert P, Hawkins N, Duerr A, McElrath M, Corey L, Self S. Peptide selection for human immunodeficiency virus type 1 CTL-based vaccine evaluation. Vaccine. 2006;24(47–48):6893–904. - PubMed
    1. Perfetto SP, Ambrozak D, Nguyen R, Chattopadhyay P, Roederer M. Quality assurance for polychromatic flow cytometry. Nat Protoc. 2006;1(3):1522–30. - PubMed
    1. Lin LI. A concordance correlation coefficient to evaluate reproducibility. Biometrics. 1989;45(1):255–68. - PubMed

LinkOut - more resources