. 2008 Sep;99(9):1813-9.
doi: 10.1111/j.1349-7006.2008.00893.x. Epub 2008 Jul 4.

Autophagy is activated in pancreatic cancer cells and correlates with poor patient outcome

Affiliations

Autophagy is activated in pancreatic cancer cells and correlates with poor patient outcome

Satoshi Fujii et al. Cancer Sci. 2008 Sep.

Abstract

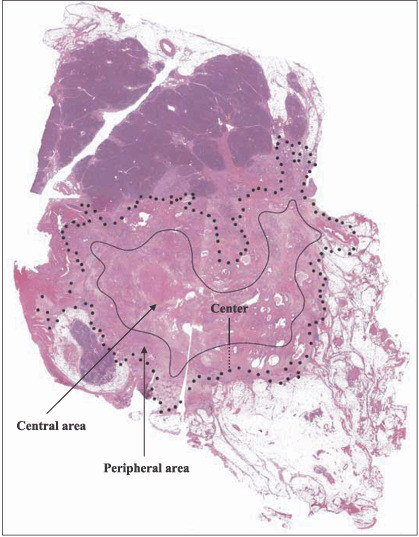
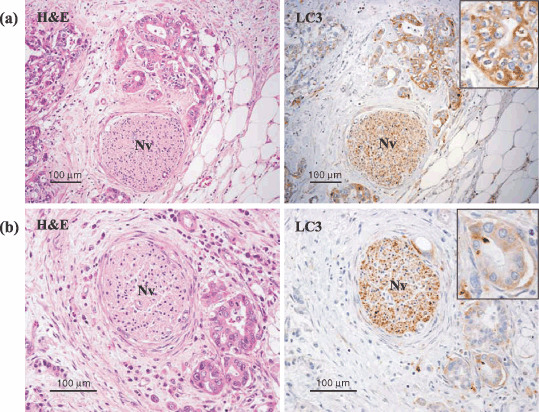
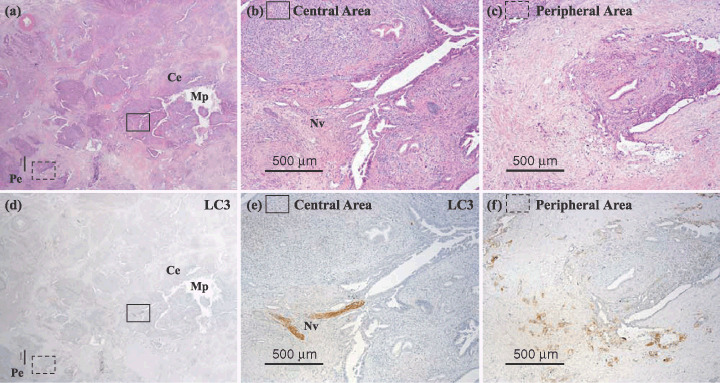
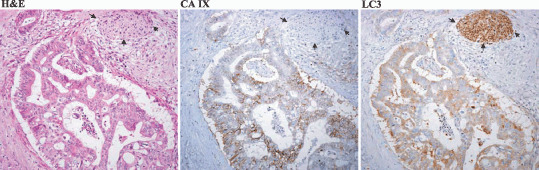
Because autonomous proliferating cancer cells are often exposed to hypoxic conditions, there must be an alternative metabolic pathway, such as autophagy, that allows them to obtain energy when both oxygen and glucose are depleted. We previously reported finding that autophagy actually contributes to cancer cell survival in colorectal cancers both in vitro and in vivo. Pancreatic cancer remains a devastating and poorly understood malignancy, and hypoxia in pancreatic cancers is known to increase their malignant potential. In the present study archival pancreatic cancer tissue was retrieved from 71 cases treated by curative pancreaticoduodenectomy. Autophagy was evaluated by immunohistochemical staining with anti-LC3 antibody, as LC3 is a key component of autophagy and has been used as a marker of autophagy. The results showed that strong LC3 expression in the peripheral area of pancreatic cancer tissue was correlated with a poor outcome (P = 0.0170) and short disease-free period (P = 0.0118). Two of the most significant correlations among the clinicopathological factors tested were found between the peripheral intensity level of LC3 expression and tumor size (P = 0.0098) or tumor necrosis (P = 0.0127). Activated autophagy is associated with pancreatic cancer cells, and autophagy is thought to be a response to factors in the cancer microenvironment, such as hypoxia and poor nutrient supply. This is the first study to report the clinicopathological significance of autophagy in pancreatic cancer.


Figures

Figure 1
Figure 1
The central area and the peripheral area of the pancreatic cancer tissue. We mapped the margin of the tumor tissue area of each case and drew a bold dotted line surrounding the tumor tissue area using some slides covering the entire tumor tissue. The margin of tumor tissue is shown as the bold dotted line. The center is decided from the overview. The midpoint between the margin and the center of the cancer tissue was defined as the border between the ‘peripheral area’ or ‘central area’. As shown, the diameter (a small‐dotted straight black line) from the marginal bold dotted line of the tumor tissue to the border line and the diameter (a black straight line) from the border line to the center of the tumor tissue were the same. The border line (a black curved line) was drawn so that the diameters were almost the same inside the tumor tissue area. In other words, the area outside the border and the area inside the border were defined as the ‘peripheral area’ and the ‘central area’, respectively. Thus, the peripheral area contained the invasive border of cancer tissue.
Figure 2
Figure 2
LC3 protein was detected in pancreatic cancer tissue by immunohistochemical staining with LC3 antibody. Cancer tissue stained immunohistochemically with LC3 antibody and corresponding hematoxylin–eosin (HE)‐stained sections are shown. A nerve cell (Nv) was used as an internal positive control to validate immunohistocheimical staining and evaluate the level of intensity of LC3 expression. The inserts are the photographs at higher magnification. (a) The cancer cells that stained as or more intensely for LC3 than the nerve cells were recorded as strongly positive. (b) The cancer cells that stained less intensely for LC3 than the nerve cells were recorded as weakly positive.
Figure 3
Figure 3
A representative pancreatic tumor is shown. Cancer tissue (d–f) stained immunohistochemically with LC3 antibody and (a–c) corresponding hematoxylin–eosin (HE)‐stained sections are shown. The peripheral area of the pancreatic cancer tissue (Pe) is more strongly positive for LC3 protein than the central area (Ce). Mp, main pancreatic duct; Nv, nerve cell.
Figure 4
Figure 4
Tumor cells with enhanced LC3 expression at the peripheral area concomitantly expressed carbonic anhydrase IX (CA IX) as a hypoxia marker. Three photographs of a representative case are shown (hematoxylin–eosin and CA IX and LC3 expression by immununohistochemical staining). The black arrows show the peripheral nerve at the peripheral area of the tumor tissue and which served as a positive internal control of LC3 expression.
Figure 5
Figure 5
Overall survival curves and disease‐free curve according to the level of intensity of LC3 protein expression in the peripheral area and the dominant overall intensity of LC3 expression. (a) Overall survival curves according to the level of intensity of LC3 expression in the peripheral area of the cancer tissue in a negative group, weakly positive group, and strongly positive group. There was a trend for patients with strongly positive expression of LC3 protein to have a poor outcome (P = 0.0579). (b) Overall survival curves according to the level of intensity of LC3 protein expression in the peripheral area of the cancer tissue in the negative and weakly positive group and the strongly positive group. The group with strongly positive expression of LC3 protein had a significantly shorter survival time (P = 0.0170). (c) Overall survival curves according to the dominant overall intensity of LC3 protein expression in the negative and weakly positive group and the strongly positive group. The group with strongly positive expression of LC3 protein had a significantly shorter survival time (P = 0.0301). (d) Disease‐free curves according to the level of intensity of LC3 protein expression in the peripheral area of the cancer tissue in the negative and weakly positive group and the strongly positive group. The group with strongly positive expression of LC3 protein in the peripheral area of the cancer tissue had a significantly shorter disease‐free period (P = 0.0118).

References

    1. Kumar V, Cotran RS, Robbins SL. Robbins Pathologic Basis of Disease, 5th edn. Philadelphia: W.B. Saunders, 1992.
    1. Jain RK. Molecular regulation of vessel maturation. Nat Med 2003: 9: 685–93. - PubMed
    1. Vaupel P, Thews O, Hoeckel M. Treatment resistance of solid tumors: role of hypoxia and anemia. Med Oncol 2001; 18: 243–59. - PubMed
    1. Harris AL. Hypoxia – a key regulatory factor in tumour growth. Nat Rev Cancer 2002; 2: 38–47. - PubMed
    1. Koong AC, Mehta VK, Le QT et al . Pancreatic tumors show high levels of hypoxia. Int J Radiat Oncol Biol Phys 2000; 48: 919–22. - PubMed

Publication types