

Phosphate metabolite concentrations and ATP hydrolysis potential in normal and ischaemic hearts
- PMID: 18617566
- PMCID: PMC2652194
- DOI: 10.1113/jphysiol.2008.154732
Phosphate metabolite concentrations and ATP hydrolysis potential in normal and ischaemic hearts
Abstract
To understand how cardiac ATP and CrP remain stable with changes in work rate - a phenomenon that has eluded mechanistic explanation for decades - data from (31)phosphate-magnetic resonance spectroscopy ((31)P-MRS) are analysed to estimate cytoplasmic and mitochondrial phosphate metabolite concentrations in the normal state, during high cardiac workstates, during acute ischaemia and reactive hyperaemic recovery. Analysis is based on simulating distributed heterogeneous oxygen transport in the myocardium integrated with a detailed model of cardiac energy metabolism. The model predicts that baseline myocardial free inorganic phosphate (P(i)) concentration in the canine myocyte cytoplasm - a variable not accessible to direct non-invasive measurement - is approximately 0.29 mm and increases to 2.3 mm near maximal cardiac oxygen consumption. During acute ischaemia (from ligation of the left anterior descending artery) P(i) increases to approximately 3.1 mm and ATP consumption in the ischaemic tissue is reduced quickly to less than half its baseline value before the creatine phosphate (CrP) pool is 18% depleted. It is determined from these experiments that the maximal rate of oxygen consumption of the heart is an emergent property and is limited not simply by the maximal rate of ATP synthesis, but by the maximal rate at which ATP can be synthesized at a potential at which it can be utilized. The critical free energy of ATP hydrolysis for cardiac contraction that is consistent with these findings is approximately -63.5 kJ mol(-1). Based on theoretical findings, we hypothesize that inorganic phosphate is both the primary feedback signal for stimulating oxidative phosphorylation in vivo and also the most significant product of ATP hydrolysis in limiting the capacity of the heart to hydrolyse ATP in vivo. Due to the lack of precise quantification of P(i) in vivo, these hypotheses and associated model predictions remain to be carefully tested experimentally.
Figures
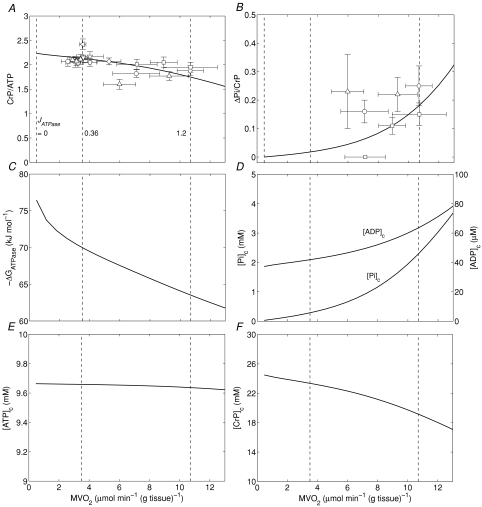
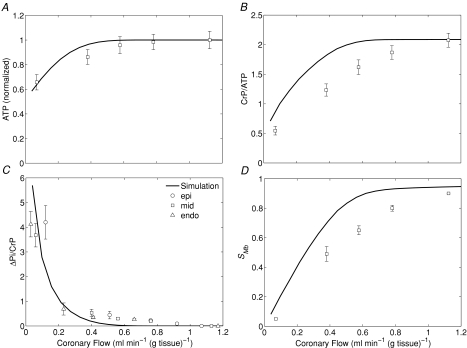
 , and compared to experimental data from canine heart in vivo. B, model-predicted steady-state ΔPi/CrP plotted as a function of
  . C, model-predicted steady-state free energy of ATP hydrolysis, −ΔGATPase, is plotted as a function of
  . D, model-predicted steady-state cytoplasmic inorganic phosphate concentration, [Pi]c and ADP, [ADP]c, plotted as a functions of
  . E, model-predicted steady-state cytoplasmic ATP, [ATP]c, plotted as a function of
  . F, model-predicted steady-state cytoplasmic CrP [CrP]c, plotted as a function of
  . For all simulations,
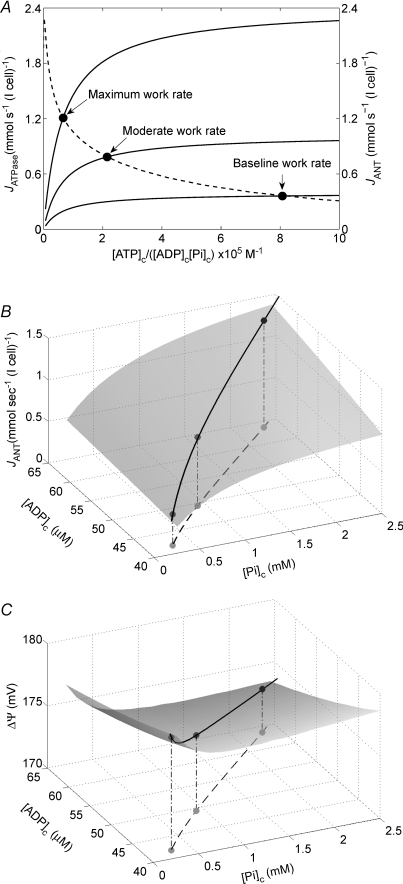
  is varied by varying the rate of ATP hydrolysis, JATPase, in the cytoplasm. Experimental data are obtained from the following sources: ○, Zhang et al. (2005) (dobutamine + dopamine); ▵, Zhang et al. (2003), ◊, Gong et al. (2003) (dobutamine + dopamine); ▵, Ochiai et al. (2001) (dobutamine + dopamine); ▿, Gong et al. (1999), □, Bache et al. (1999) (dobutamine, dobutamine +dopamine). Here protocols used to elevate work load from baseline are indicated in parentheses. The values of JATPase corresponding to baseline and maximal
  , 0.36 and 1.2 mmol s−1 (l cell)−1, respectively, are indicated in A. Error bars indicate standard error.
References
-
- Allen DG, Orchard CH. Myocardial contractile function during ischemia and hypoxia. Circ Res. 1987;60:153–168. - PubMed
-
- Bache RJ, Zhang J, Murakami Y, Zhang Y, Cho YK, Merkle H, Gong G, From AH, Ugurbil K. Myocardial oxygenation at high workstates in hearts with left ventricular hypertrophy. Cardiovasc Res. 1999;42:616–626. - PubMed
-
- Balaban RS. Regulation of oxidative phosphorylation in the mammalian cell. Am J Physiol Cell Physiol. 1990;258:C377–C389. - PubMed
-
- Balaban RS. Cardiac energy metabolism homeostasis: role of cytosolic calcium. J Mol Cell Cardiol. 2002;34:1259–1271. - PubMed
Publication types
MeSH terms
Substances
Grants and funding
LinkOut - more resources
Full Text Sources
Research Materials
Miscellaneous