. 2009 Jan;40(1):19-30.
doi: 10.1165/rcmb.2008-0105OC. Epub 2008 Jul 10.

Regulation of COX-2 expression and IL-6 release by particulate matter in airway epithelial cells

Affiliations

Regulation of COX-2 expression and IL-6 release by particulate matter in airway epithelial cells

Yutong Zhao et al. Am J Respir Cell Mol Biol. 2009 Jan.

Abstract

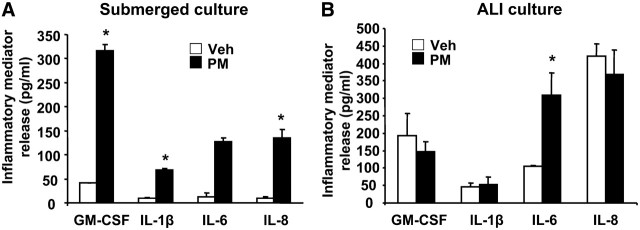
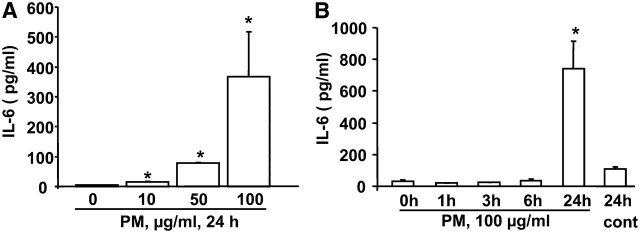
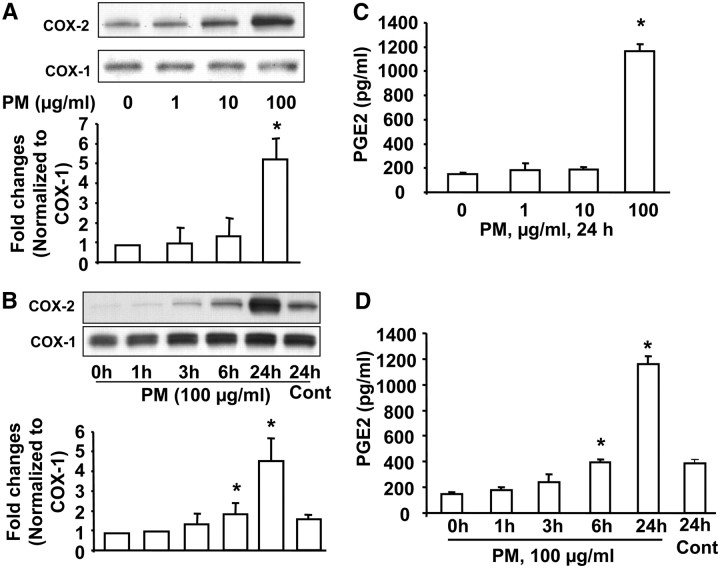
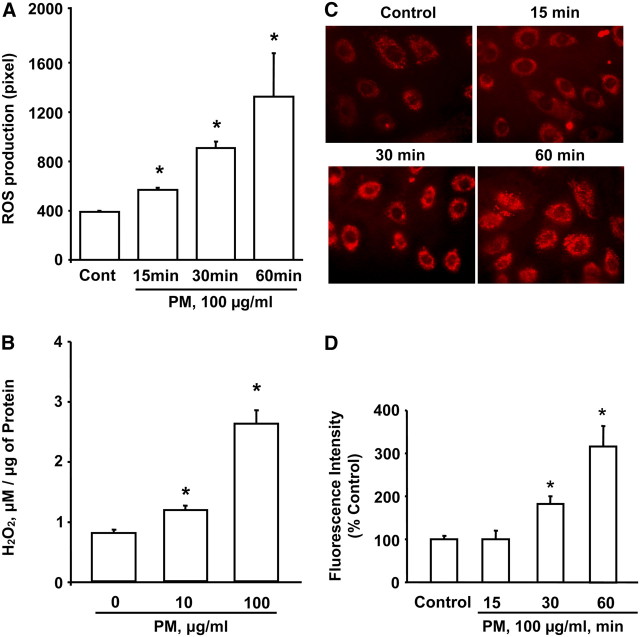
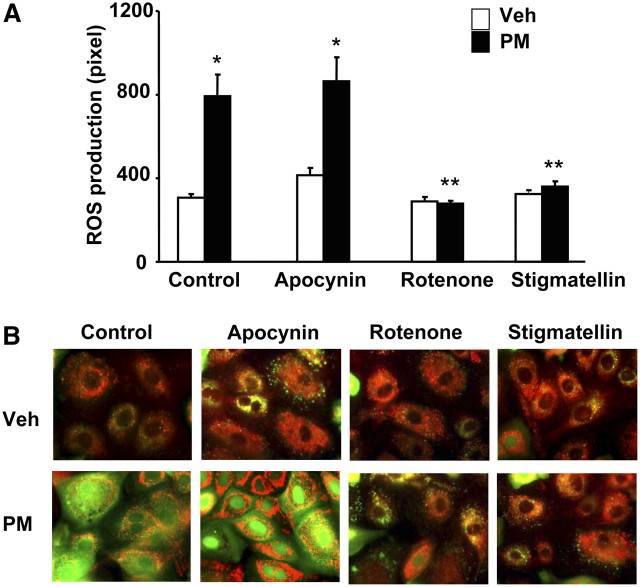
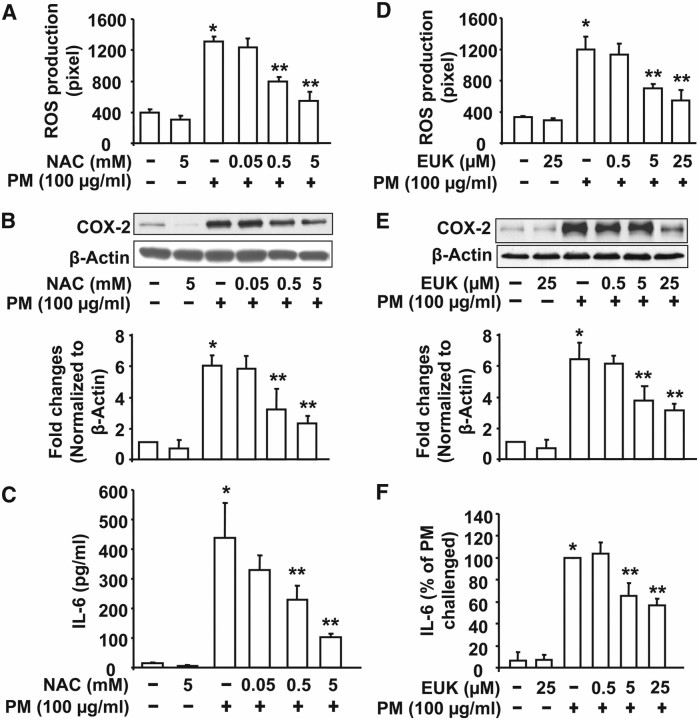
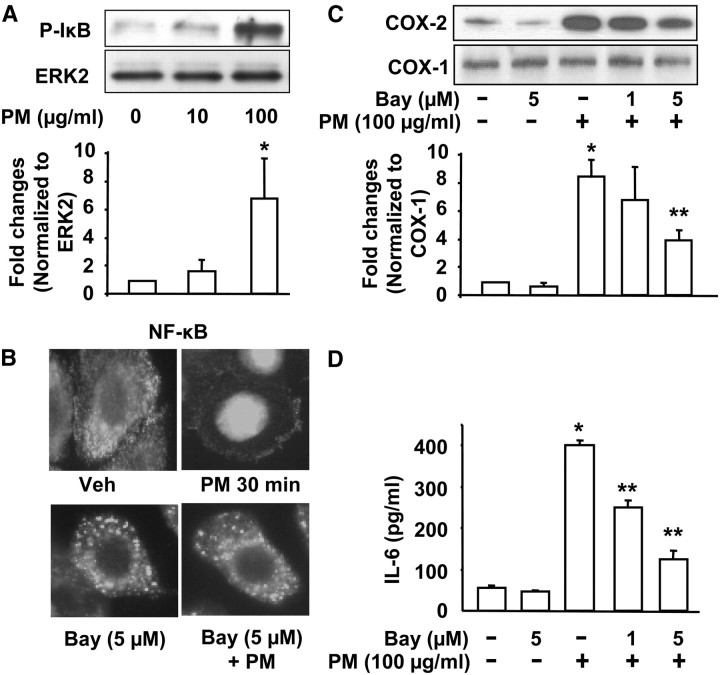
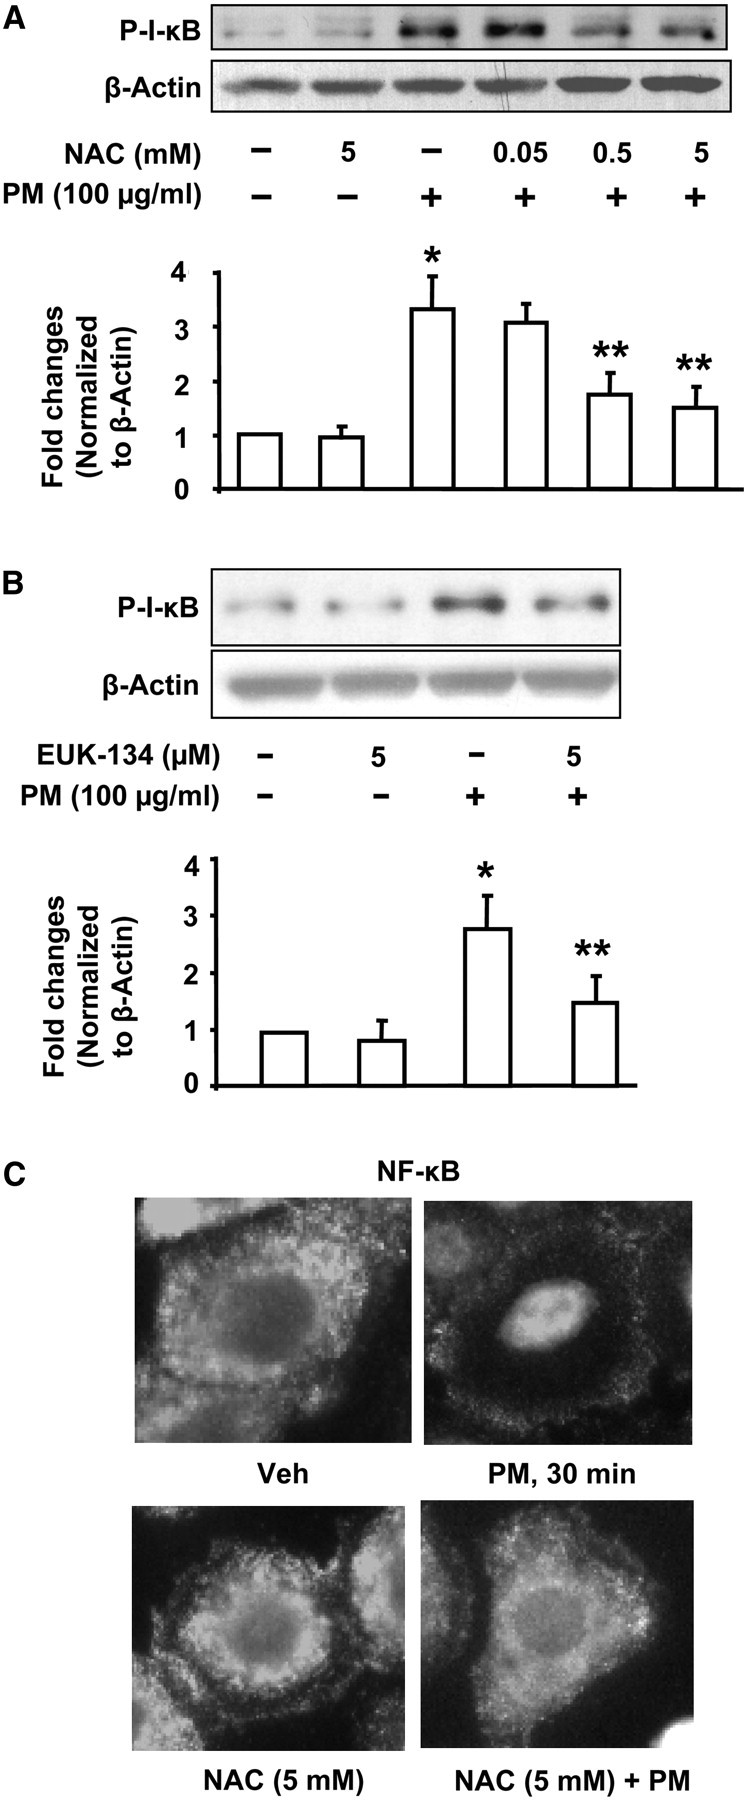
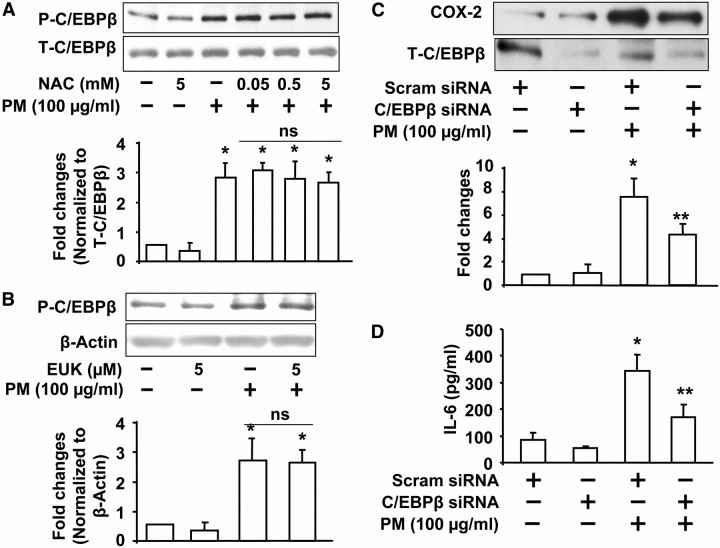
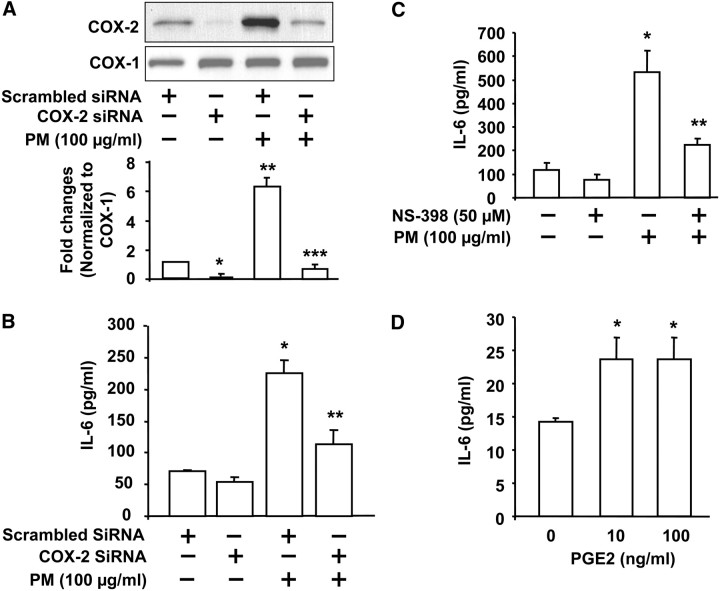
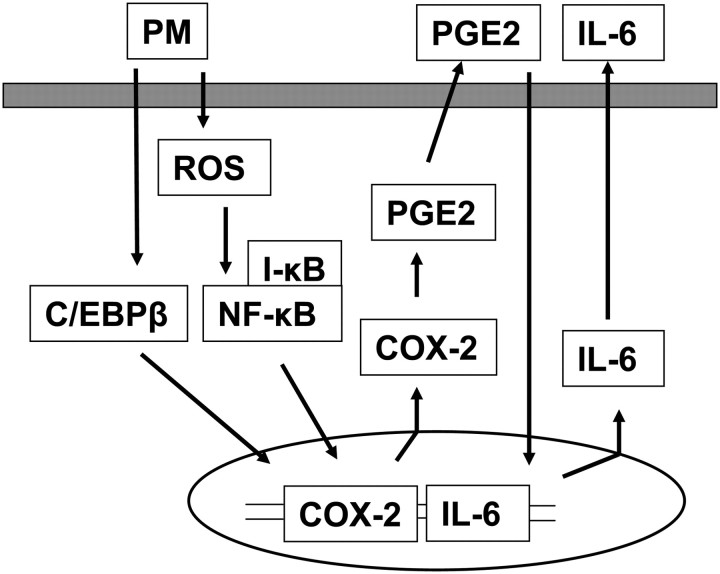
Particulate matter (PM) in ambient air is a risk factor for human respiratory and cardiovascular diseases. The delivery of PM to airway epithelial cells has been linked to release of proinflammatory cytokines; however, the mechanisms of PM-induced inflammatory responses are not well-characterized. This study demonstrates that PM induces cyclooxygenase (COX)-2 expression and IL-6 release through both a reactive oxygen species (ROS)-dependent NF-kappaB pathway and an ROS-independent C/EBPbeta pathway in human bronchial epithelial cells (HBEpCs) in culture. Treatment of HBEpCs with Baltimore PM induced ROS production, COX-2 expression, and IL-6 release. Pretreatment with N-acetylcysteine (NAC) or EUK-134, in a dose-dependent manner, attenuated PM-induced ROS production, COX-2 expression, and IL-6 release. The PM-induced ROS was significantly of mitochondrial origin, as evidenced by increased oxidation of the mitochondrially targeted hydroethidine to hydroxyethidium by reaction with superoxide. Exposure of HBEpCs to PM stimulated phosphorylation of NF-kappaB and C/EBPbeta, while the NF-kappaB inhibitor, Bay11-7082, or C/EBPbeta siRNA attenuated PM-induced COX-2 expression and IL-6 release. Furthermore, NAC or EUK-134 attenuated PM-induced activation of NF-kappaB; however, NAC or EUK-134 had no effect on phosphorylation of C/EBPbeta. In addition, inhibition of COX-2 partly attenuated PM-induced Prostaglandin E2 and IL-6 release.


Figures

Figure 1.
Figure 1.
Inflammatory cytokine production by Baltimore particulate matter (PM) in submerged and air–liquid interface grown human bronchial epithelial cells (HBEpCs). HBEpCs grown (A) submerged or (B) at air-liquid interface were challenged with Baltimore PM (100 μg/ml) for 24 hours. Media were collected and centrifuged at 2,000 × g at 4°C, and cytokine levels were quantified by enzyme-linked immunosorbent assay (ELISA). Values are mean ± SD of three independent determinations in triplicate and expressed as picograms of cytokine released per milligram of protein in cell lysates. *Significantly different from cells exposed to vehicle alone (P < 0.05).
Figure 2.
Figure 2.
Dose- and Time-dependent release of IL-6 by Baltimore PM. HBEpCs grown to approximately 90% confluence were exposed to (A) varying concentrations or (B) different time periods with 100 μg/ml of Baltimore PM. At the end of the experiment, media were collected, centrifuged to remove any floating cells, and analyzed for IL-6 release by ELISA. Values are mean ± SD of at least three independent experiments. *Significantly different from cells exposed to 0 hours (P < 0.05).
Figure 3.
Figure 3.
Baltimore PM induces cyclooxygenase (COX)-2 expression and prostaglandin (PG)E2 release. In A and C, HBEpCs grown to approximately 90% confluence were treated with varying concentrations of Baltimore PM (1, 10, and 100 μg/ml) for 24 hours. (A) Cell lysates (20 μg proteins) were subjected to SDS-PAGE and Western blotted with anti–COX-1 and –COX-2 antibodies. Shown are representative blots from three independent experiments. Quantitative analyses from three independent experiments (mean ± SD). *P < 0.05 versus vehicle. (C) Total PGE2 released in the medium was quantified by ELISA. Values are mean ± SD of three independent experiments in triplicate and expressed as pg of PGE2/ml of medium. *Significantly different from vehicle-treated cells (P < 0.01). In B and D, HBEpCs (∼ 90% confluence) were exposed to Baltimore PM (100 μg/ml) for 1, 3, 6, and 24 hours. At each time point, media were collected and cell lysates were prepared. (B) Cell lysates (20 μg proteins) were subjected to SDS-PAGE and Western blotted for COX-1 and COX-2. Shown are representative blots from three independent experiments. Quantitative analyses from three independent experiments (mean ± SD). *P < 0.05 versus 0 hours. (D) Media from the various time points were analyzed for PGE2 release by ELISA. Values are mean ± SD of three independent experiments in triplicate and expressed as pg of PGE2/ml of medium. *Significantly different from vehicle-treated cells (P < 0.01).
Figure 4.
Figure 4.
Baltimore PM induces reactive oxygen species (ROS) generation in HBEpCs. (A) HBEpCs grown on glass bottom-dishes to approximately 90% confluence were loaded with 10 μM DCFDA for 30 minutes. Cells were rinsed in basal medium without growth factors and exposed to Baltimore PM (100 μg/ml) for 15, 30, and 60 minutes. At the end of exposure, ROS formation was visualized under fluorescence microscope and quantified using image analysis. (B) HBEpCs grown on 35-mm dishes to approximately 90% confluence were challenged with 10 or 100 μg/ml of Baltimore PM for 60 minutes. Media were collected and H2O2 levels were measured using the Amplex Red assay. Values are mean ± SD of three experiments. *Significantly different from cells exposed to vehicle alone (P < 0.05). (C) HBEpCs grown on glass-bottom dishes to approximately 90% confluence, challenged with Baltimore PM (100 μg/ml) for 15, 30, and 60 minutes. At the end of each time point, cells were washed with EBM phenol red free media and were loaded with MitoSOX (1 μM) for 10 minutes. Cells were washed three times with EBM phenol red free media and intracellular MitoSOX Red-emitted fluorescence was visualized by immunofluorescence microscopy. (D) Intracellular MitoSOX Red-emitted fluorescence of C quantified by image analysis using MetaVue software. Values are mean ± SD of three independent experiments. *Significantly different from cells exposed to vehicle (P < 0.05).
Figure 5.
Figure 5.
PM-induced ROS generation is dependent on mitochondrial electron transport. (A) HBEpCs grown to approximately 90% confluence were pretreated with apocynin (50 μM) or rotenone (2 μM) or stigmatellin (1 μM) for 1 hour before loading with 10 μM DCFDA for 30 minutes. Cells were rinsed and challenged with vehicle or vehicle plus Baltimore PM (100 μg/ml) for 30 minutes. Formation of ROS was quantified by immunofluorescence microscopy. Values are mean ± SD of three independent experiments. *Significantly different from cells exposed to vehicle (P < 0.05); **significantly different from cells challenged with Baltimore PM (P < 0.01). (B) HBEpCs grown on glass coverslips to approximately 90% confluence were pretreated with apocynin (50 μM), rotenone (2 μM), or stigmatellin (1 μM) for 1 hour before loading with 10 μM DCFDA and 50 nM Mito Tracker for 30 minutes. Cells were challenged with vehicle or vehicle plus Baltimore PM (100 μg/ml) for 30 minutes, and cells were visualized for ROS generation (green) and Mito Tracker (red) marker using fluorescence microscope. Co-localization of ROS (green) in mitochondria with Mito Tracker (red) is shown as yellow. Shown is a representative immunofluorescence micrograph from three independent experiments.
Figure 6.
Figure 6.
N-Acetylcysteine and EUK-134 attenuate Baltimore PM–induced ROS generation, COX-2 expression, and IL-6 secretion. HBEpCs grown in 35-mm dishes to approximately 90% confluence were pretreated with varying concentrations of N-acetylcysteine (NAC) (0.05, 0.5, and 5 mM) or EUK-134 (0.5, 5, and 25 μM) for 1 hour. In A and D, cells were loaded with 10 μM DCFDA for 30 minutes before addition of Baltimore PM (100 μg/ml) and ROS generation was quantified after 60 minutes using immunofluorescence microscopy. Values are mean ± SD of three independent experiments. *Significantly different from cells treated with vehicle (P < 0.01); **significantly different from cells exposed to Baltimore PM (P < 0.05). In B and E, cells after pretreatment with vehicle or NAC or EUK-134 were challenged with Baltimore PM (100 μM) for 24 hours, and cell lysates (20 μg proteins) were subjected to SDS-PAGE and Western blotted with anti–COX-2 and actin antibodies. Shown are representative blots from three independent experiments. Quantitative analyses from three independent experiments (mean ± SD). *P < 0.05 versus vehicle; **P < 0.05 versus PM challenge. In C and F, media were collected from cells (B and E), and analyzed for IL-6 by ELISA. Values are mean ± SD from three independent experiments in triplicate and represented as pg/ml of medium. *Significantly different from vehicle treated cells (P < 0.05); **significantly different from cells challenged with Baltimore PM (P < 0.001).
Figure 7.
Figure 7.
Baltimore PM-induced COX-2 expression and IL-6 secretion via NF-κB. In A, HBEpCs grown in 35-mm dishes to approximately 95% confluence were starved in basal EBM medium without any growth factors for 3 hours, and then challenged with Baltimore PM (10 and 100 μg/ml) for 15 minutes. Cell lysates (20 μg proteins) were subjected to SDS-PAGE and Western blotted with phospho-IkB and ERK2 antibodies. Shown are representative blots and quantitative analyses from three independent experiments (mean ± SD). *P < 0.05 versus vehicle. **P < 0.05 versus PM challenge. In B, HBEpCs in glass coverslips (∼ 95% confluence) were pretreated with Bay compound (5 μM) for 60 minutes, cells were challenged with vehicle or vehicle plus Baltimore PM (100 μg/ml) for 15 minutes. Cells were washed, fixed, permeabilized, probed with anti-p65 antibody, and examined by immunofluorescence microscopy using a ×60 oil objective. Shown is a representative image from several independent experiments. In C, HBEpCs grown on 35-mm dishes were pretreated with varying concentrations of Bay compound (1 and 5 μM) for 60 minutes. Cells were challenged with vehicle or vehicle plus Baltimore PM (100 μg/ml) for 24 hours, cell lysates (20 μg proteins) were subjected to SDS-PAGE, and Western blotted with anti–COX-2 and actin antibodies. Shown are representative blots and quantitative analyses from three independent experiments (mean ± SD). *P < 0.05 versus vehicle; **P < 0.05 versus PM challenge. In D, media from C were analyzed by ELISA for IL-6. Values are mean ± SD from three independent experiments in triplicate. *Significantly different from cells exposed to vehicle (P < 0.01); **significantly different from cells exposed to Baltimore PM (P < 0.05).
Figure 8.
Figure 8.
N-Acetylcysteine and EUK-134 attenuate Baltimore PM-induced NF-κB activation. HBEpCs grown in 35-mm dishes to approximately 90% confluence were pretreated with varying concentrations of N-acetylcysteine (NAC) (0.05, 0.5, and 5 mM) or EUK-134 (5 μM) for 1 hour. In A and B, cells were challenged with vehicle or vehicle plus Baltimore PM (100 μg/ml) for 15 minutes, and cell lysates (20 μg proteins) were subjected to SDS-PAGE and Western blotted with anti–phospho-IkB and actin antibodies. Shown are representative blots and quantitative analyses from three independent experiments (mean ± SD). *P < 0.05 versus vehicle; **P < 0.05 versus PM challenge. In C, HBEpCs grown on glass coverslips (∼ 95% confluence) were pretreated with NAC (5 mM) for 60 minutes, cells were challenged with vehicle or vehicle plus Baltimore PM (100 μg/ml) for 15 minutes, and cells were washed, fixed, permeabilized, probed with anti-p65 antibody, and examined by immunofluorescence microscopy using a ×60 oil objective. Shown is a representative image from several independent experiments.
Figure 9.
Figure 9.
C/EBPβ regulates Baltimore PM–induced COX-2 expression and IL-6 secretion via ROS-independent pathway. In A and B, HBEpCs grown on 35-mm dishes to approximately 90% confluence were pretreated with varying concentrations of NAC (0.05, 0.5, and 5 mM) or EUK-134 (5 μM) for 1 hour. Cells were challenged with vehicle or vehicle plus Baltimore PM (100 μg/ml) for 15 minutes, and cell lysates (20 μg proteins) were subjected to SDS-PAGE and Western blotted with anti–phospho-C/EBPβ or C/EBPβ antibodies. Shown are representative blots and quantitative analyses from three independent experiments (mean ± SD). *P < 0.05 versus vehicle. In C, HBEpCs grown on 35-mm dishes to approximately 50% confluence were transfected with scrambled siRNA or C/EBPβ siRNA (100 nM) for 72 hours. Cells were challenged with vehicle or vehicle plus Baltimore PM (100 μg/ml) for 24 hours, and cell lysates (20 μg proteins) were subjected to SDS-PAGE and Western blotted with anti–COX-2 or C/EBPβ antibodies as described in Materials and Methods. Shown are representative blots and quantitative analyses from three independent experiments (mean ± SD). *P < 0.05 versus vehicle; **P < 0.05 versus PM challenge. In D, media from C were analyzed for IL-6 by ELISA. Values are mean ± SD from three independent experiments. *Significantly different from vehicle-challenged cells (P < 0.05); **significantly different from cells challenged with Baltimore PM (P < 0.01).
Figure 10.
Figure 10.
Involvement of COX-2 and PGE2 in Baltimore PM–induced IL-6 secretion. In A and B, HBEpCs grown on 35-mm dishes to approximately 50% confluence were transfected with scrambled siRNA (50 nM) or COX-2 siRNA (50 nM) for 72 hours before challenge with vehicle or vehicle plus Baltimore PM (100 μg/ml) for 24 hours. In A, cell lysates (20 μg proteins) were subjected to SDS-PAGE, and Western blotted with anti–COX-2 or –COX-1 antibodies. Shown are representative blots and quantitative analyses from three independent experiments. * and ** significantly different from scrambled siRNA-transfected cells exposed to vehicle (P < 0.01); *** significantly different from COX-2 siRNA-transfected cells exposed to PM (P < 0.01). In B, media from A were collected and analyzed for IL-6 by ELISA. Values are mean ± SD from three independent experiments. *Significantly different from scrambled siRNA-transfected cells exposed to vehicle (P < 0.01); **significantly different from scrambled siRNA-transfected cells exposed to Baltimore PM (P < 0.01). In C, HBEpCs grown to approximately 90% confluence were pretreated with COX-2 inhibitor, NS-398 (50 μM) for 1 hour, cells were challenged with vehicle or vehicle plus Baltimore PM (100 μg/ml) for 24 hours, and media were analyzed for IL-6 by ELISA. Values are mean ± SD from three independent experiments. *Significantly different from cells challenged with vehicle (P < 0.05); **significantly different from cells exposed to Baltimore PM (P < 0.01). In D, PGE2 (10, and 100 ng/ml) was added to HBEpCs grown on 35-mm dishes for 6 hours, media were collected, and analyzed for IL-6 by ELISA. Values are mean ± SD from three independent experiments. *Significantly different from cells exposed to vehicle (P < 0.05).
Figure 11.
Figure 11.
Proposed signaling pathways of ROS-dependent and -independent activation of COX-2 in PM-induced IL-6 secretion in HBEpCs. Exposure of epithelium to PM results in ROS generation and activation of NF-κB, which regulates COX-2 and IL-6 secretion. PM-induced expression of COX-2 enhances PGE2 that stimulates IL-6 in HBEpCs. Independent of ROS generation, PM also stimulates COX-2 expression via C/EBPβ signaling. These results suggest multiple pathways involved in ambient PM–mediated IL-6 generation in airway epithelium, which involve ROS-dependent and -independent activation of COX-2 and PGE2 signal transduction.

References

    1. Oberdorster G, Gelein RM, Ferin J, Weiss B. Association of particulate air pollution and acute mortality: involvement of ultrafine particles? Inhal Toxicol 1995;7:111–124. - PubMed
    1. Samet JM, Dominici F, Curriero FC, Coursac I, Zeger SL. Fine particulate air pollution and mortality in 20 US cities, 1987–1994. N Engl J Med 2000;343:1742–1749. - PubMed
    1. Dominici F, McDermott A, Zeger SL, Samet JM. Airborne particulate matter and mortality: timescale effects in four US cities. Am J Epidemiol 2003;157:1055–1065. - PubMed
    1. Samet JM, Krewski D. Health effects associated with exposure to ambient air pollution. J Toxicol Environ Health A 2007;70:227–242. - PubMed
    1. Sandstrom T. Respiratory effects of air pollutants: experimental studies in humans. Eur Respir J 1995;8:976–995. - PubMed

Publication types

MeSH terms