. 2008 Jul;50(7):840-51.
doi: 10.1097/JOM.0b013e31816b44dd.

The relationships between lost work time and duration of absence spells: proposal for a payroll driven measure of absenteeism

Affiliations

The relationships between lost work time and duration of absence spells: proposal for a payroll driven measure of absenteeism

James J Hill 3rd et al. J Occup Environ Med. 2008 Jul.

Abstract

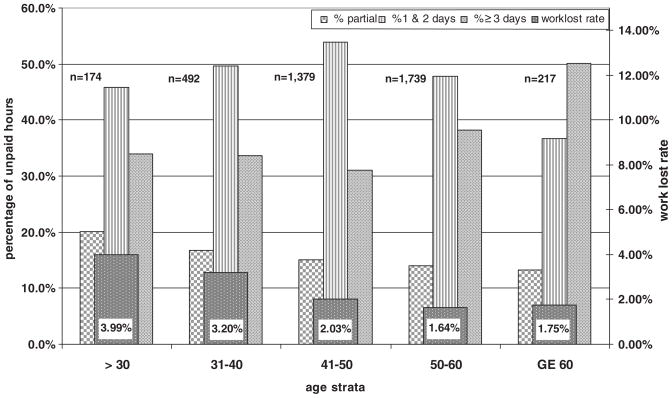
Objective: To propose a standard measure of absenteeism (the work lost rate [WLR]) be included in future research to facilitate understanding and allow for translation of findings between scientific disciplines.

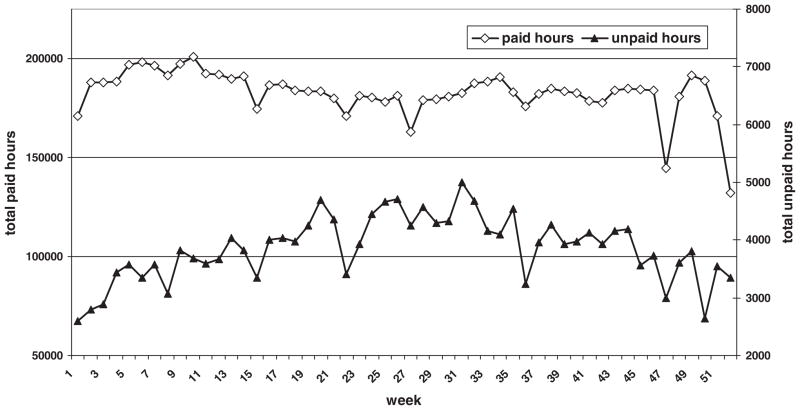
Methods: Hourly payroll data derived from "punch clock" reports was used to compare various measures of absenteeism used in the literature and the application of the proposed metric (N = 4000 workers).

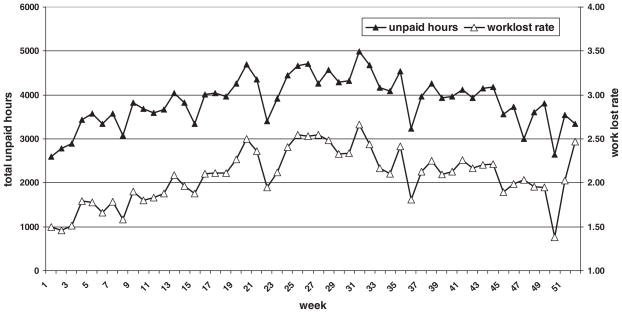
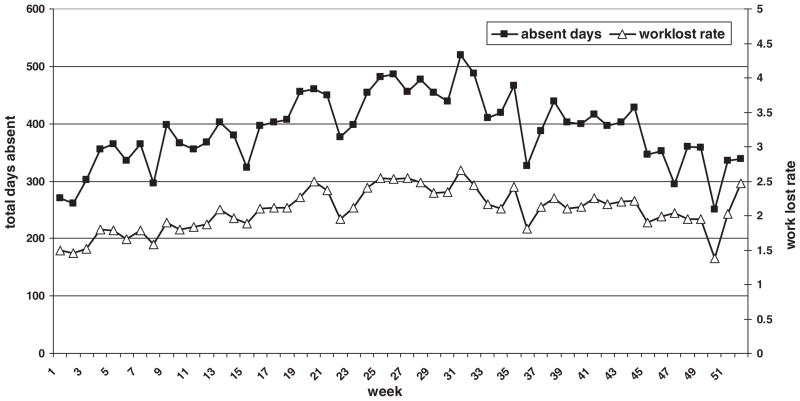
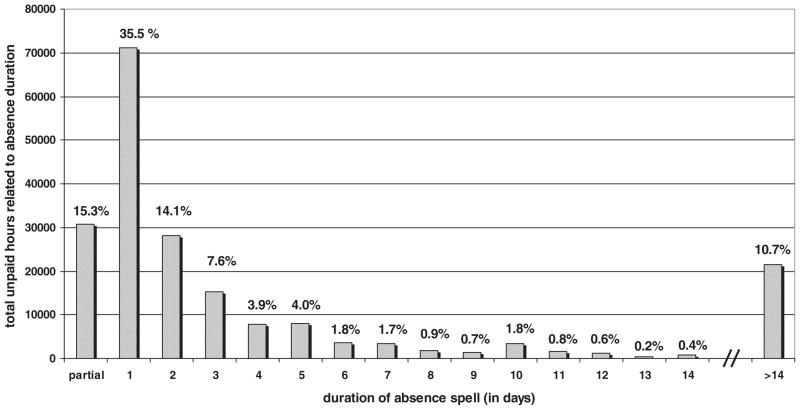
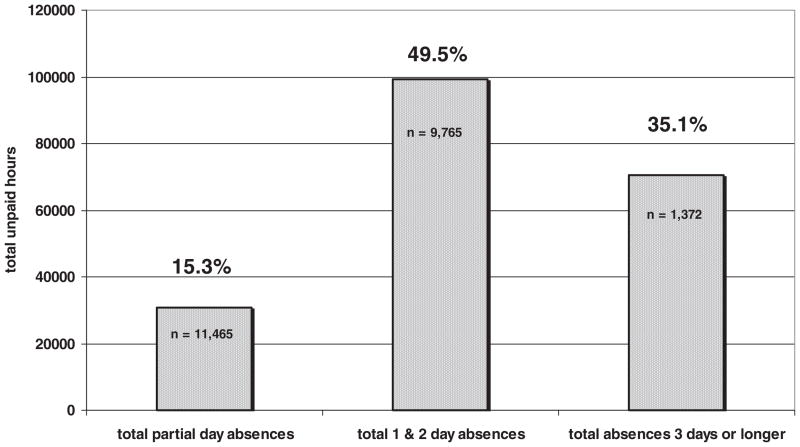
Results: Unpaid hours and full absent days were highly correlated with the WLR (r = 0.896 to 0.898). The highest percentage of unpaid hours (lost work time) is captured by absence spells of 1 and 2 days duration.

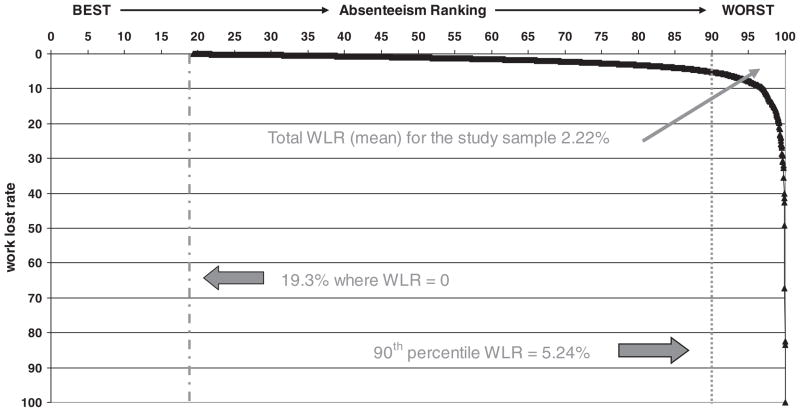
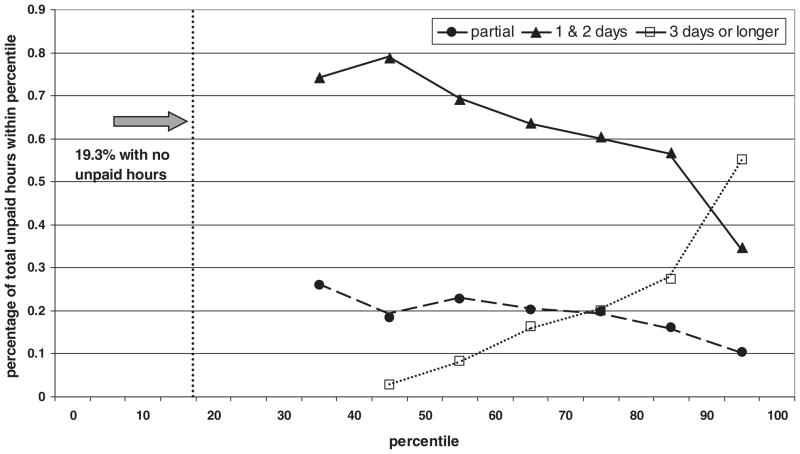
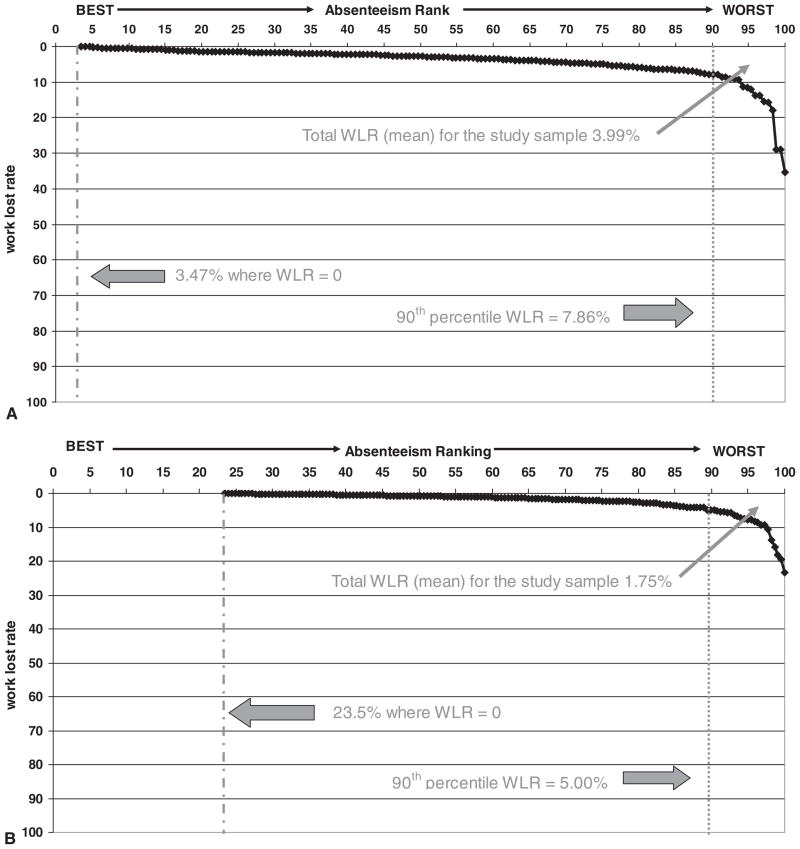
Conclusion: The proposed WLR metric captures: 1) The range and distribution of the individual WLRs, 2) the percentage of subjects with no unpaid hours, and 3) the population WLR and should be included whenever payroll data is used to measure absenteeism.


Conflict of interest statement

Competing Interests: Dr Cullen, Mr. Slade, Ms. Cantley, Ms. Vegso, and Ms. Fiellin provide consultant services to Alcoa Inc, under a research or service agreement With Yale University.

Figures

Fig. 1
Fig. 1
Paid and unpaid hours for 52 consecutive work weeks beginning January 1, 2001 at three primary aluminum manufacturing sites (N = 4000).Total paid hours = 9,499,060, and total unpaid hours = 200,618.
Fig. 2
Fig. 2
Unpaid hours and WLR [(unpaid hours)/(unpaid hours + paid work hours)] × 100 for 52 consecutive work weeks beginning January 1, 2001 at three primary aluminum manufacturing sites (N = 4000). Mean WLR by week: 2.07, median 2.10, SD 0.31, range, 1.38 to 2.66. Correlation coefficient = 0.898.
Fig. 3
Fig. 3
WLR by absenteeism rank (N = 4000). Note: 1) the percentage of the work force with no unpaid hours (WLR = 0) (19.3%) and 2) the range and distribution of the WLR. The total WLR (mean) for the sample is the area over the curve.
Fig. 4
Fig. 4
Absence days (using definition I) and WLR for 52 consecutive work weeks beginning January 1, 2001 at three primary aluminum manufacturing sites (N = 4000). Mean absent days per week: 390, median 397, SD 61.9, range, 250 to 519. Correlation coefficient = 0.896.
Fig. 5
Fig. 5
Distribution and percentage of total unpaid hours by duration of absence spell. There were 11,465 partial absence days, 8086 1-day absences, 1679 2-day absences, and 601 3-day absences. Eighty-five absences lasted greater than 14 days with a median of 200 unpaid hours per spell (range, 120 to 1712 hours).
Fig. 6
Fig. 6
Total unpaid hours by absence spell duration (partial days absent, 1 and 2 days absences, absences lasting 3 days or longer). Percentage of total absence hours and number of occurrences is reported (N = 4000).
Fig. 7
Fig. 7
Percent distribution of unpaid hours by percentile (density) as determined by total unpaid hours (N = 4000). 19.3% of employees (N = 773) had no unpaid hours during the year (0 to 20th percentile). The 21 to 30th percentile had no 1-day or 2-day absences.
Fig. 8
Fig. 8
Distribution of unpaid hours by duration of absence spell (partial, 1 and 2 day, and 3 days or longer) stratified by age. The WLR for each group is shown for each age strata (N = 4000).
Fig. 9
Fig. 9
A, WLR by absenteeism rank for workers less than 30 years old as of January 1, 2001 (N = 174). Note: 1) the percentage of the work force with no unpaid hours (WLR = 0) (3.47%) and 2) the range and distribution of the WLR. The total WLR (mean) for the sample is the area over the curve. B, Work lost rate (WLR) by cumulative percentage for workers 60 years or older as of January 1, 2001 (N = 217). Note: 1) the percentage of the work force with no unpaid hours (WLR = 0) (23.5%) and 2) the range and distribution of the WLR. The total WLR (mean) for the sample is the area over the curve.

References

    1. Walsh DC, Conner E, Tracey LV, Goldberg GA, Egdahl RH. Posthospital convalescence and return to work. Health Aff. 1989;8:76–90. - PubMed
    1. Chadwick-Jones J. Social Psychology of Absenteeism. New York: Praeger; 1982.
    1. Goodman RS. Absenteeism. San Francisco: Jossey-Bass Inc; 1984.
    1. Steers RM, Rhodes SR. Major influences on employee attendance: a process model. J Appl Psychol. 1978;63:391–407.
    1. Bureau of Labor Statistics. USDOL. Current Population Survey. Bureau of Labor Statistics; 2007.

Publication types