. 2008 Aug;118(8):2697-710.
doi: 10.1172/JCI33093.

Androgen receptor-negative human prostate cancer cells induce osteogenesis in mice through FGF9-mediated mechanisms

Affiliations

Androgen receptor-negative human prostate cancer cells induce osteogenesis in mice through FGF9-mediated mechanisms

Zhi Gang Li et al. J Clin Invest. 2008 Aug.

Abstract

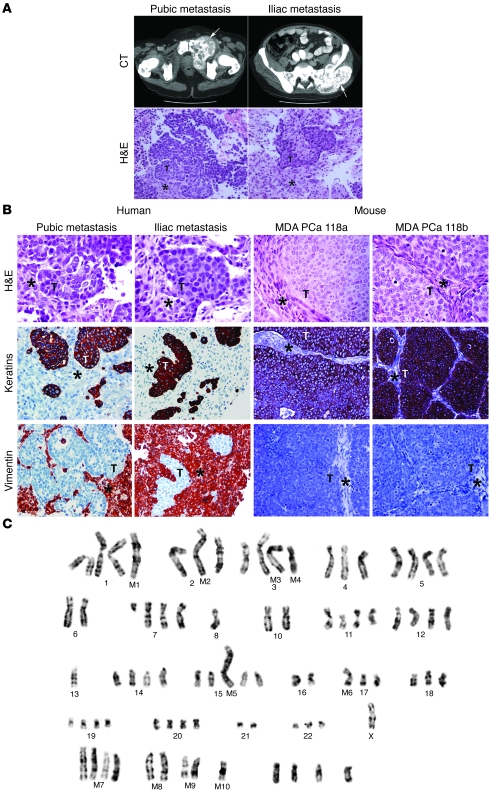
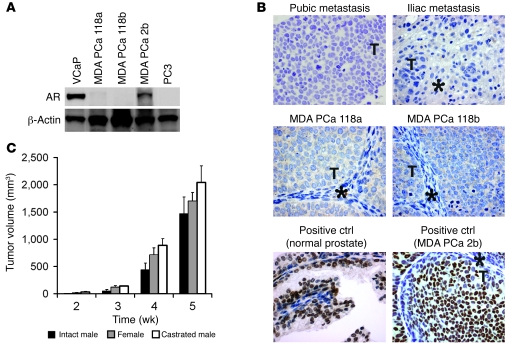
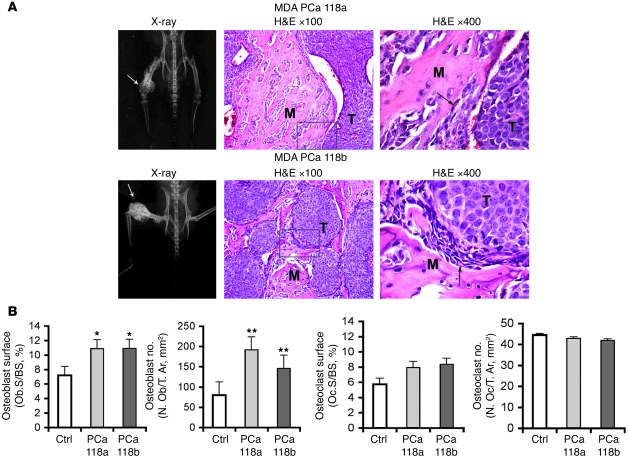
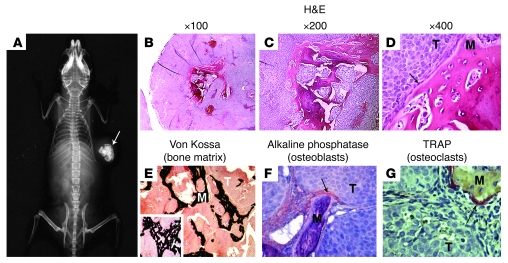
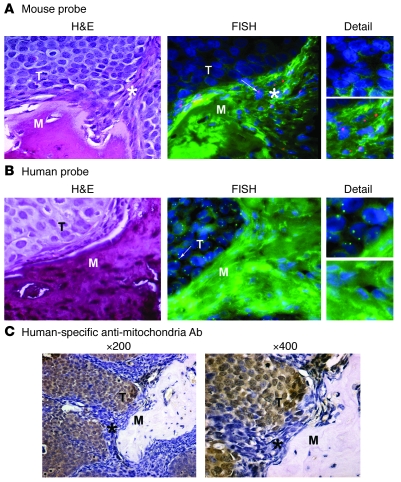
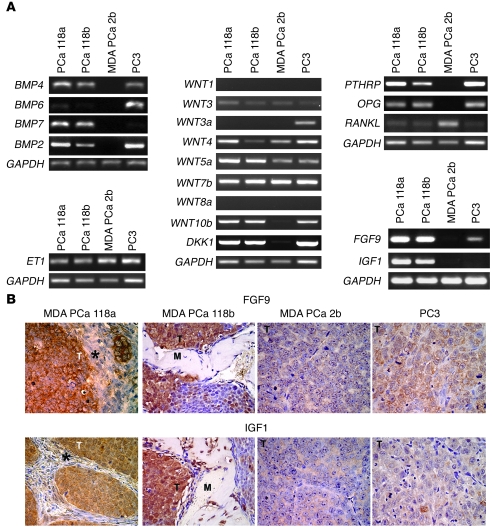
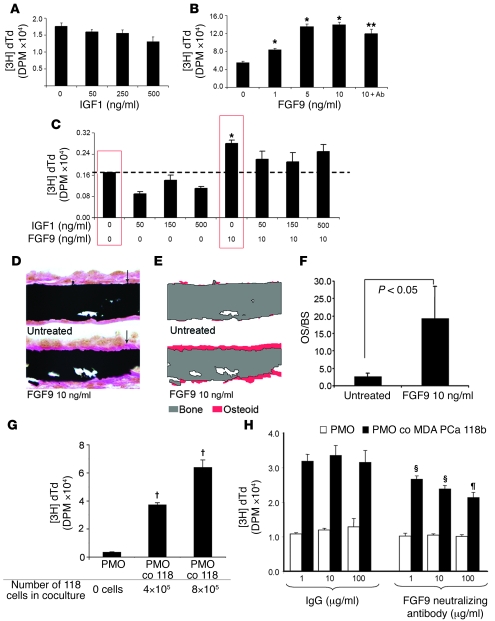
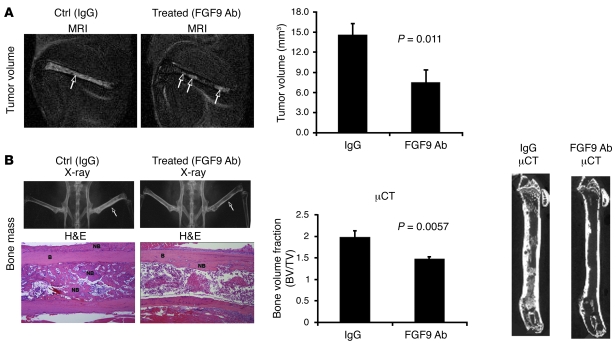
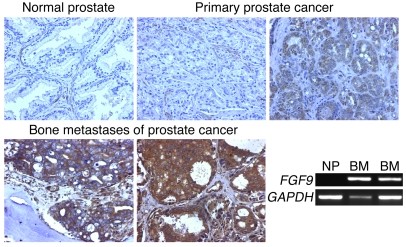
In prostate cancer, androgen blockade strategies are commonly used to treat osteoblastic bone metastases. However, responses to these therapies are typically brief, and the mechanism underlying androgen-independent progression is not clear. Here, we established what we believe to be the first human androgen receptor-negative prostate cancer xenografts whose cells induced an osteoblastic reaction in bone and in the subcutis of immunodeficient mice. Accordingly, these cells grew in castrated as well as intact male mice. We identified FGF9 as being overexpressed in the xenografts relative to other bone-derived prostate cancer cells and discovered that FGF9 induced osteoblast proliferation and new bone formation in a bone organ assay. Mice treated with FGF9-neutralizing antibody developed smaller bone tumors and reduced bone formation. Finally, we found positive FGF9 immunostaining in prostate cancer cells in 24 of 56 primary tumors derived from human organ-confined prostate cancer and in 25 of 25 bone metastasis cases studied. Collectively, these results suggest that FGF9 contributes to prostate cancer-induced new bone formation and may participate in the osteoblastic progression of prostate cancer in bone. Androgen receptor-null cells may contribute to the castration-resistant osteoblastic progression of prostate cancer cells in bone and provide a preclinical model for studying therapies that target these cells.


Figures

Figure 1
Figure 1. The origin of MDA PCa 118 xenografts; histopathologic and immunohistochemical stains of human tissue biopsy specimens and the derived MDA PCa 118 variant; and the karyotype of MDA PCa 118b cells.
(A) Top: Contrast-enhanced CT scans of the pelvis of a 49-year-old man of mixed European descent with androgen-independent prostate cancer show the expansile ossified lesion involving the left pubis (arrow, left panel) that was the source of MDA PCa 18a cells and the left ilium (arrow, right panel) that was the source of the MDA PCa 118b cells. Bottom: H&E-stained tissue sections of biopsy specimens from the lesions in the pubic (arrow, top left panel) and iliac (arrow, top right panel) metastases. Original magnification, ×200. T, prostate cancer cells; asterisks indicate stroma. (B) Top row: H&E-stained biopsy specimens of the pubic and iliac metastases and the MDA PCa 118a and 118b variants. Middle row: Cytokeratin-stained sections. Bottom row: Vimentin-stained sections. The mouse stroma in the xenografts did not stain for vimentin because the Ab (clone V9) reacts with human, not mouse, vimentin. Original magnification, ×200. T, prostate cancer cells; asterisks indicate stroma. (C) Giemsa-banded karyotype of MDA PCa 118b human prostate cancer cells showing marker chromosomes (M1–M10) and various anomalies. The tentative identification of the markers is as follows: M1, iso(1p); M2, t(3q;6p); M3, t(3q;?); M4, del(3p); M5, 15p+; M6, 17p+; M7 and M8, markers containing an abnormally banded region (ABR); M9, t(11q;18q); M10, unidentified marker.
Figure 2
Figure 2. Androgen receptor expression in the human tissue biopsy samples and MDA PCa 118 variants and the in vivo growth of MDA PCa 118b cells in sham-operated male, female, or castrated male mice.
(A) Western blot of androgen receptor (AR) expression in the MDA PCa 118a and MDA PCa 118b prostate cancer xenografts probed with mAb against human androgen receptor. Positive controls were the human prostate cancer cell lines VCaP and MDA PCa 2b, and the negative control was the human prostate cancer cell line PC3. β-Actin was used as a loading control. (B) Immunohistochemical staining of biopsy samples from the pubic metastasis (the source of MDA PCa 118a) and iliac metastasis (source of MDA PCa 118b) and of the MDA PCa 118a and MDA PCa 118b xenografts with an Ab against human androgen receptor. Normal prostate and MDA PCa 2b cells grown subcutaneously in SCID mice were used as positive controls (ctrl). Original magnification, ×200. (C) Volume of tumors formed 2–5 weeks after subcutaneous injection of MDA PCa 118b cells in sham-operated (intact) male, female, and castrated male mice (5 per group). Tumor volumes (in mm3) were calculated using the formula for volume of an ellipsoid [4/3π (length/2 × width/2 × height/2)]. Error bars indicate SEM.
Figure 3
Figure 3. MDA PCa 118 variants growing in bones of immunodeficient mice.
(A) Radiographs at left show mouse pelvis and rear limbs 9 weeks after intrafemoral implantation of MDA PCa 118a (top) and MDA PCa 118b cells (bottom). Arrows indicate increased density in bone and exophytic lesions resembling the human sample of origin. The middle and right panels show H&E-stained sections of lesions induced by the intrafemoral implantation of MDA PCa 118a and MDA PCa 118b cells into intact male SCID mice. M, bone matrix; arrows indicate osteoblasts. Right panels show higher magnification of the areas indicated by boxes in the middle panels. (B) Osteoblast- and osteoclast-associated parameters quantified with the OsteoMeasure system (OsteoMetrics). Ob(Oc).S/BS, osteoblast (osteoclast) surface as a percentage of bone surface; N. Ob(Oc)/T. Ar, number of osteoblasts (osteoclasts) per area of tissue. Error bars indicate SEM. *P < 0.05; **P < 0.0125.
Figure 4
Figure 4. MDA PCa 118b xenograft growing subcutaneously in immunodeficient mice.
(A) Whole-body radiograph of mouse with subcutaneous MDA PCa 118b implant indicates bone-like increase in density in the tumor area (arrow). (BG) Histologic analyses of MDA PCa 118b cells growing subcutaneously. (BD) Representative areas of MDA PCa 118b xenograft with bone-like extracellular matrix (H&E stain; original magnifications, ×100, ×200, and ×400). Arrow indicate osteoblasts. (E) Positive von Kossa staining (black) indicates calcified matrix in the MDA PCa 118b xenograft. Original magnification, ×100; inset original magnification, ×400. (F) Positive alkaline phosphatase (red) staining in bone lining cells indicates osteoblasts (arrow). Original magnification, ×400. (G) TRAP (red) staining indicates osteoclasts (arrow). Original magnification, ×400.
Figure 5
Figure 5. FISH and immunohistochemical analyses of MDA PCa 118b xenografts grown subcutaneously in SCID mice.
(A) Photomicrographs of H&E-stained sections and FISH analyses with mouse Y chromosome paint probe (labeled with red CY3). Sections processed for FISH analysis were obtained at a distance of 15–30 μm from the H&E-stained section. Photomicrographs from FISH analysis were taken with FITC filters to visualize the tissue structure and were merged with photomicrographs of the same areas taken with a CY3 filter (to visualize the red CY3-labeled mouse chromosome) and DAPI (to visualize the blue cell nuclei). The bright red dots, seen only in the stromal area, are CY3-labeled mouse chromosome probes. Original magnification, ×630; detail, ×850. The arrow indicates the CY3-labeled mouse chromosome (red dot) that is included in the area of detail. (B) Photomicrographs of H&E–stained sections and FISH analysis with FITC-labeled human centromere probes for chromosome 7. Sections processed for FISH analysis were obtained at a distance of 15–30 μm from the H&E-stained section. Photomicrographs from FISH analysis were taken with FITC (to visualize the green FITC-labeled human centromere probes) and were merged with photomicrographs of same areas taken with a DAPI filter (to visualize the blue cell nuclei). The bright green dots, seen only in the tumor area, are FITC-labeled human centromere probes. Original magnification, ×630; detail, ×950. The arrow indicates the FITC-labeled human chromosome (bright green dot) that is included in the area of detail (C) Staining with Ab specific to human mitochondria. The areas of stroma and bone-like matrix are negative for the human antigen.
Figure 6
Figure 6. Gene expression patterns in prostate cancer xenografts.
(A) RT-PCR analyses of BMP genes; WNT genes and DKK1; endothelin-1 (ET1); PTHRP, osteoprotegerin (OPG), and RANKL; and IGF1 and FGF9 in MDA PCa 118a, MDA PCa 118b, MDA PCa 2b, and PC3 prostate cancer xenograft cells. (B) Immunohistochemical analyses of prostate cancer xenografts grown subcutaneously in SCID mice. Asterisk indicates stroma. Original magnification, ×400.
Figure 7
Figure 7. Effects of FGF9 on osteoblast proliferation and new bone formation.
(AC) [3H]thymidine ([3H] dTd) incorporation into primary mouse osteoblasts after 48 hours of culturing in medium alone or medium supplemented with increasing concentrations of IGF1 (A), with increasing concentrations of FGF9 or 10 ng/ml of FGF9 plus 1 μg/ml of Ab against FGF9 (B), or with both (C). Results were confirmed in 2 independent experiments. *P < 0.01, control versus treatment; **P < 0.01, primary mouse osteoblasts cultured with 10 ng/ml of FGF9 versus primary mouse osteoblasts cultured with 10 ng/ml of FGF9 plus 1 μg/ml of Ab against FGF9. (D) Von Kossa–stained cross sections of bone (calvarial) organ cultures left untreated or treated with 10 ng/ml of FGF9. Each treatment condition included calvariae from 3 different mice. Arrows indicate osteoid (i.e., uncalcified bone matrix). Original magnification, ×1,000. (E) Schematic representation of the images in D illustrates the calcified bone matrix (gray) and osteoid (red) components. (F) Osteoid surface (OS) area versus bone surface (BS) area on the von Kossa–stained sections as quantified with the OsteoMeasure system. Similar results were obtained in another independent experiment. P < 0.05 for untreated versus FGF9-treated calvariae. (G) [3H]thymidine incorporation into primary mouse osteoblasts growing alone (PMO) and into those cocultured with MDA PCa 118b cells (PMO co 118). Similar results were obtained in an independent experiment. P < 0.001, PMO versus PMO co 118. (H) [3H]thymidine incorporation into PMO or PMO co 118b and treated with 1–100 μg/ml of FGF9-neutralizing Ab or the IgG isotype control. P < 0.001, PMO versus PMO co 118b; §P < 0.05, P < 0.01, PMO co 118b plus FGF9-neutralizing Ab versus PMO co 118b plus IgG. Similar results were obtained in an independent experiment. In A–C and F–H, data are presented as mean ± SEM.
Figure 8
Figure 8. Effects of FGF9 blockade on MDA PCa 118b bone growth and osteoblastic reaction in vivo.
(A) Tumor volume. MDA PCa 118b tumor visualized and quantified by T2-weighted, fat-suppressed MR. Left and middle: Representative axial MR images of mice injected with MDA PCa 118b cells in the femur and obtained after 5 weeks of treatment with FGF9-neutralizing Ab or IgG isotype. Arrows indicate tumor. Tumors were confined to the bone, spreading throughout the femur area in the IgG-treated mice (control) and scattered in the bone area in the mice treated with FGF9-neutralizing Ab. Right: Volumes of regions of increased signal in the MDA PCa 118b–injected femur measured by MR after 5 weeks of treatment were significantly higher in the control than in the treated mice (P = 0.011). (B) Bone mass. X-ray: Radiographs show mouse pelvis and rear limbs of mice 7 weeks after intrafemoral injection of MDA PCa 118b cells in the control and treatment groups. Arrows indicate area illustrated in the lower panels. H&E: H&E-stained sections of MDA PCa 118b–bearing femurs. Note that the marrow cavity is filled with new bone (NB) in the femurs of the control but not the treated mice. B, bone matrix; NB, new bone. μCT: Effect of FGF9 blockade on bone volume fraction. Bottom right: Cross-sectional μCT images of both control treated (IgG) and neutralizing Ab–treated (FGF9 Ab) tumor-bearing bones. Error bars indicate SEM.
Figure 9
Figure 9. FGF9 expression in normal prostate and prostate cancer.
Upper panels and lower left and middle panels: Immunohistochemical staining with Ab against FGF9 in normal prostate, 2 cases of organ-confined primary prostate cancer (1 positive and 1 negative for FGF9 expression), and 2 cases of bone metastases of prostate cancer. Original magnification, ×200. Lower right panel: RT-PCR analysis of FGF9 expression in normal prostate (NP) and 2 case of bone metastases of prostate cancer (BM).

References

    1. Jemal A., et al. Cancer statistics, 2007. CA Cancer J. Clin. 2007;57:43–66. - PubMed
    1. Catalona W.J. Management of Cancer of the Prostate. N. Engl. J. Med. 1994;331:996–1004. doi: 10.1056/NEJM199410133311507. - DOI - PubMed
    1. Cook G.B., Watson F.R. Events in the natural history of prostate cancer: using salvage curves, mean age distributions and contingency coefficients. J. Urol. 1968;99:87–96. - PubMed
    1. Clarke N.W., McClure J., George N.I. Osteoblast function and osteomalacia in metastatic prostate cancer. Eur. Urol. 1993;24:286–290. - PubMed
    1. Charhon S.A., et al. Histomorphometric analysis of sclerotic bone metastases from prostatic carcinoma with special reference to osteomalacia. Cancer. 1983;51:918–924. doi: 10.1002/1097-0142(19830301)51:5<918::AID-CNCR2820510526>3.0.CO;2-J. - DOI - PubMed

Publication types

MeSH terms