. 2008 Aug;118(8):2959-68.
doi: 10.1172/JCI34277.

Activation of hypothalamic S6 kinase mediates diet-induced hepatic insulin resistance in rats

Affiliations

Activation of hypothalamic S6 kinase mediates diet-induced hepatic insulin resistance in rats

Hiraku Ono et al. J Clin Invest. 2008 Aug.

Abstract

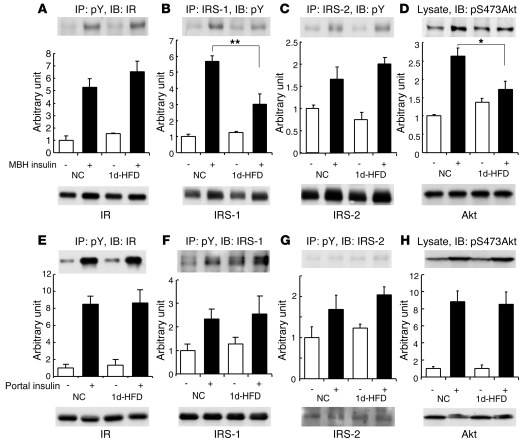
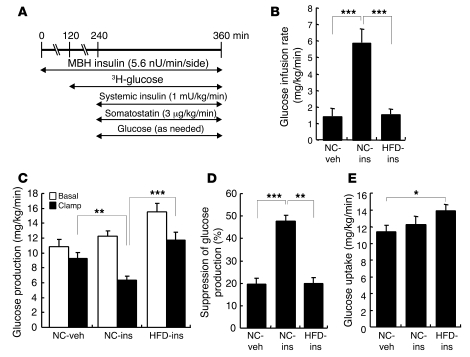
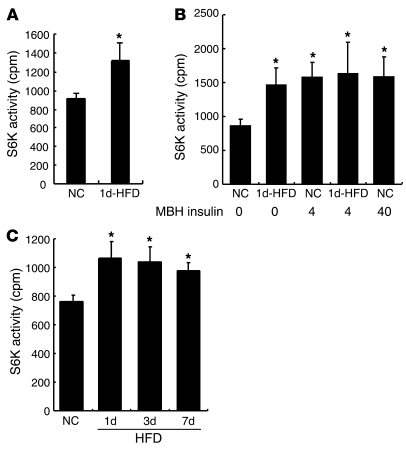
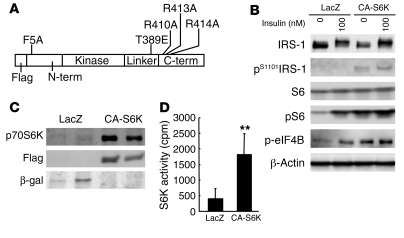
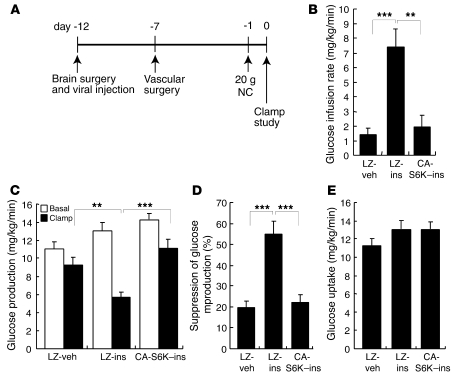
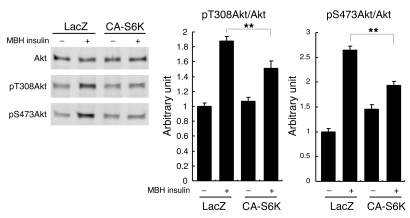
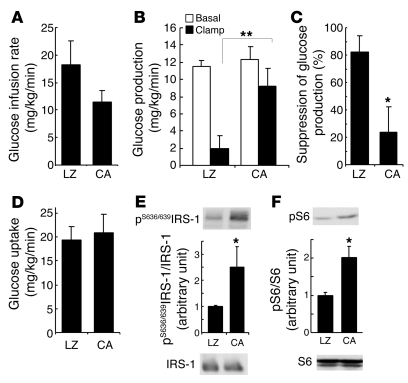
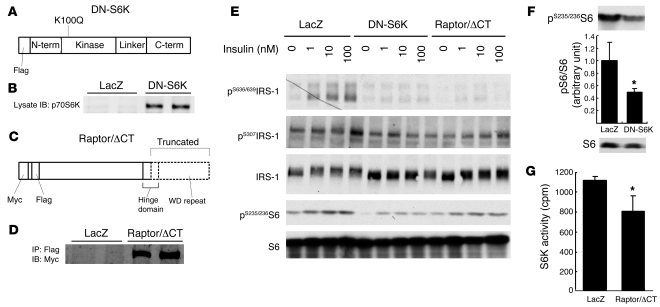
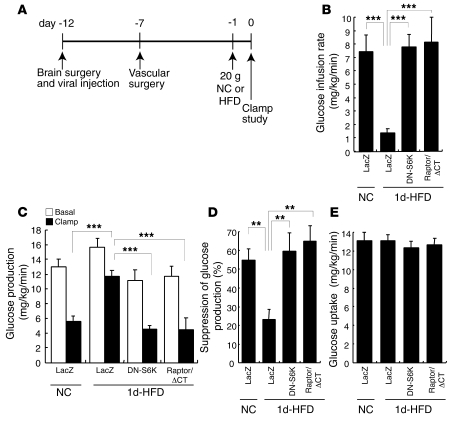
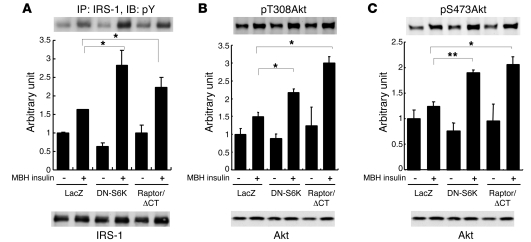
Prolonged activation of p70 S6 kinase (S6K) by insulin and nutrients leads to inhibition of insulin signaling via negative feedback input to the signaling factor IRS-1. Systemic deletion of S6K protects against diet-induced obesity and enhances insulin sensitivity in mice. Herein, we present evidence suggesting that hypothalamic S6K activation is involved in the pathogenesis of diet-induced hepatic insulin resistance. Extending previous findings that insulin suppresses hepatic glucose production (HGP) partly via its effect in the hypothalamus, we report that this effect was blunted by short-term high-fat diet (HFD) feeding, with concomitant suppression of insulin signaling and activation of S6K in the mediobasal hypothalamus (MBH). Constitutive activation of S6K in the MBH mimicked the effect of the HFD in normal chow-fed animals, while suppression of S6K by overexpression of dominant-negative S6K or dominant-negative raptor in the MBH restored the ability of MBH insulin to suppress HGP after HFD feeding. These results suggest that activation of hypothalamic S6K contributes to hepatic insulin resistance in response to short-term nutrient excess.


Figures

Figure 1
Figure 1. HFD feeding for 1 d blunts insulin signaling in the MBH at the level of IRS-1 without altering hepatic insulin signaling.
Rats were fed NC or HFD for 1 d. Insulin was infused into the MBH (4 μU) or the portal vein (1 U/kg), and 15 min or 3 min later, respectively, MBH (AD) or the liver (EH) was harvested and analyzed. Tyrosine phosphorylations of IR (A and E), IRS-1 (B and F), and IRS-2 (C and G) were studied by immunoprecipitation with anti-phosphotyrosine (pY) antibody and blotted with anti-IR (A and E), anti–IRS-1 (F), anti–IRS-2 (G), or immunoprecipitation with anti–IRS-1 (B) or anti–IRS-2 (C) antibodies and blotting with anti-phosphotyrosine antibody. (D and H) Tissue lysates were blotted with anti-pSer473 Akt antibody. Graphs show the ratio of phosphoproteins to total proteins. *P < 0.05; **P < 0.01.
Figure 2
Figure 2. HFD feeding for 1 d induces insulin resistance in the brain-liver circuit.
Rats were fed NC or HFD (171% of the energy of NC) for 1 d. After 5 h of fasting, vehicle (veh) or 4 μU insulin (ins) was infused into the MBH for the entire 6-h duration of the clamp study. (A) Clamp protocol. Equilibration period, 0–120 min; basal period, 120–240 min; insulin clamp period, 240–360 min, during which systemic insulin and glucose were continuously infused and the rate of the latter was adjusted to maintain euglycemia. (B) Glucose infusion rate required to maintain euglycemia during the clamp period. (C) HGP during the basal and clamp periods. (D) Clamp/basal HGP suppression ratio. (E) Peripheral glucose uptake during the clamp period. *P < 0.05; **P < 0.01; ***P < 0.001.
Figure 3
Figure 3. MBH S6K activity increased in the HFD-fed model.
(A) S6K activity was assayed in the MBH of rats fed NC or HFD for 1 d. (B) At 12 d after MBH cannulation, rats fed NC or HFD for 1 d were fasted for 5 h and injected with 0, 4, or 40 μU insulin for 5 min. After 40 min, the MBH was harvested and processed for S6K assay. (C) Rats were fed HFD for 0, 1, 3, or 7 d. On the last day, all rats were fed 20 g NC or HFD. After 5 h of fasting, the MBH was harvested and processed for S6K assay. *P < 0.05 versus NC.
Figure 4
Figure 4. Hypothalamic overexpression of CA-S6K and functional validation in GT1-7 hypothalamic cells.
(A) Construction of CA-S6K. (B) Adenovirus-infected GT1-7 cells were stimulated with insulin for 30 min. Serine phosphorylations in the basal state (0 nM insulin) of S6, IRS-1, and eIF4B were increased to maximal levels (comparable to LacZ expression with 100 nM insulin) by CA-S6K overexpression (P < 0.01; n = 2). The ratios of phosphoproteins to total proteins, and of phosphoproteins to actin, were statistically analyzed. Representative bands are shown. (C) Expression of CA-S6K in the MBH. MBH tissue lysates obtained 12 d after viral injection were immunoblotted with anti-S6K, anti–M5-Flag, or anti–β-gal antibodies. (D) S6K activity in MBH samples. **P < 0.01 versus LacZ.
Figure 5
Figure 5. Hypothalamic overexpression of CA-S6K leads to insulin resistance in the basal pancreatic clamp.
(A) Protocol for surgery, viral injection, and the insulin clamp study. (B) Glucose infusion rate required to maintain euglycemia during the clamp period. (C) Glucose production during basal and clamp periods. (D) Clamp/basal HGP suppression ratio. (E) Peripheral glucose uptake during the clamp period. LZ, LacZ. **P < 0.01; ***P < 0.001.
Figure 6
Figure 6. Hypothalamic overexpression of CA-S6K blunts Akt phosphorylation.
After 5 h of fasting, 4 μU insulin was infused into the MBH, and 15 min later, the MBH was harvested and analyzed. MBH lysates were blotted with anti–phospho-Thr308 and anti–phospho-Ser473 Akt antibodies. Results are shown as representative bands with quantitation. **P < 0.01.
Figure 7
Figure 7. Hypothalamic overexpression of CA-S6K leads to insulin resistance under hyperinsulinemic-euglycemic clamp conditions.
(A) Glucose infusion rate required to maintain euglycemia during the clamp period. (B) Glucose production during basal and clamp periods. (C) Clamp/basal HGP suppression ratio. (D) Peripheral glucose uptake during the clamp period. (E) Phosphoserine IRS-1 and (F) phosphoserine S6 at the end of the clamp study. Graphs show the ratio of phosphoproteins to total proteins. *P < 0.05 versus LacZ. **P < 0.01.
Figure 8
Figure 8. Hypothalamic overexpression of DN-S6K or Raptor/ΔCT and functional validation of these viruses in hypothalamic GT1-7 cells and rat MBH.
(A) Construction of kinase-dead DN-S6K. (B) Confirmation of DN-S6K expression in the MBH. (C) Construction of Raptor/ΔCT. A part of the hinge domain and all WD repeat domains were removed. The N terminus had Myc and Flag tags. (D) Confirmation of Raptor/ΔCT expression in the MBH. MBH lysate was immunoprecipitated with anti-Flag antibody and immunoblotted with anti-Myc antibody. (E) Adenovirus-infected GT1-7 cells were stimulated with 0, 1, 10, or 100 nM insulin for 30 min. Serine phosphorylations in the insulin-stimulated state of S6 and IRS-1 at Ser636/639 and Ser307 were significantly reduced by DN-S6K and Raptor/ΔCT overexpression (phosphoproteins/total protein ratio, P < 0.01, 2-way repeated-measures ANOVA; n = 2). Representative bands are shown. (F) Overexpression of DN-S6K suppressed phosphorylation of S6 in the MBH of rats fed HFD for 1 d. (G) Overexpression of Raptor/ΔCT suppressed S6K activity in the MBH of 1 d HFD-fed rats. *P < 0.05 versus LacZ.
Figure 9
Figure 9. Hypothalamic overexpression of DN-S6K or Raptor/ΔCT reverses insulin resistance in HFD-fed rats.
(A) DN-S6K or Raptor/ΔCT adenoviruses were injected into the MBH, and 12 d later, insulin clamp studies were performed on rats fed NC or HFD for 1 d. (B) Glucose infusion rate required to maintain euglycemia during the clamp period. (C) Glucose production during basal and clamp periods. (D) Clamp/basal HGP suppression ratio. (E) Peripheral glucose uptake during the clamp period. **P < 0.01; ***P < 0.001.
Figure 10
Figure 10. Insulin signaling in the MBH is improved by adenoviral inhibition of the mTOR/S6K pathway.
Rats were fed NC or HFD for 1 d, and insulin signaling was analyzed 15 min after infusion of insulin (4 μU total) into the MBH. The tyrosine phosphorylation of IRS-1 (A) and phosphorylation of Akt at Thr308 (B) and at Ser473 (C) by insulin were enhanced in response to the overexpression of DN-S6K or Raptor/ΔCT. All graphs show the ratio of phosphoproteins to total proteins. *P < 0.05; **P < 0.01.

References

    1. Hay N., Sonenberg N. Upstream and downstream of mTOR. Genes Dev. 2004;18:1926–1945. doi: 10.1101/gad.1212704. - DOI - PubMed
    1. Fingar D.C., Blenis J. Target of rapamycin (TOR): an integrator of nutrient and growth factor signals and coordinator of cell growth and cell cycle progression. Oncogene. 2004;23:3151–3171. doi: 10.1038/sj.onc.1207542. - DOI - PubMed
    1. Corradetti M.N., Guan K.L. Upstream of the mammalian target of rapamycin: do all roads pass through mTOR? Oncogene. 2006;25:6347–6360. doi: 10.1038/sj.onc.1209885. - DOI - PubMed
    1. Avruch J., et al. Insulin and amino-acid regulation of mTOR signaling and kinase activity through the Rheb GTPase. Oncogene. 2006;25:6361–6372. doi: 10.1038/sj.onc.1209882. - DOI - PubMed
    1. Inoki K., Zhu T., Guan K.L. TSC2 mediates cellular energy response to control cell growth and survival. Cell. 2003;115:577–590. doi: 10.1016/S0092-8674(03)00929-2. - DOI - PubMed

Publication types

Substances