. 2008 Aug;118(8):2832-44.
doi: 10.1172/JCI35808.

Lnk controls mouse hematopoietic stem cell self-renewal and quiescence through direct interactions with JAK2

Affiliations

Lnk controls mouse hematopoietic stem cell self-renewal and quiescence through direct interactions with JAK2

Alexey Bersenev et al. J Clin Invest. 2008 Aug.

Abstract

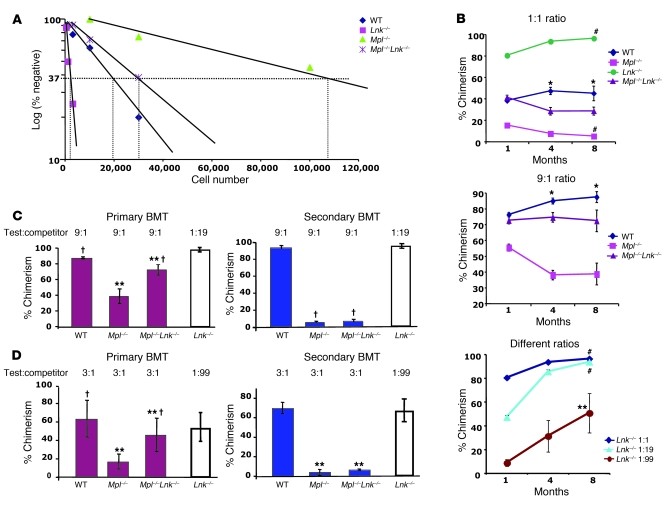
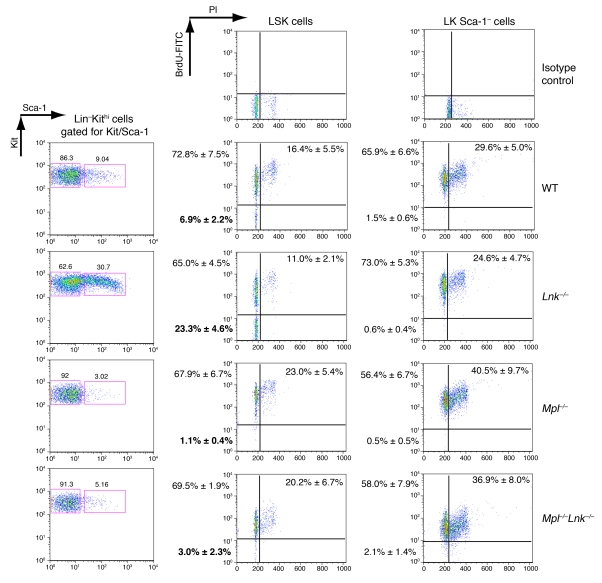
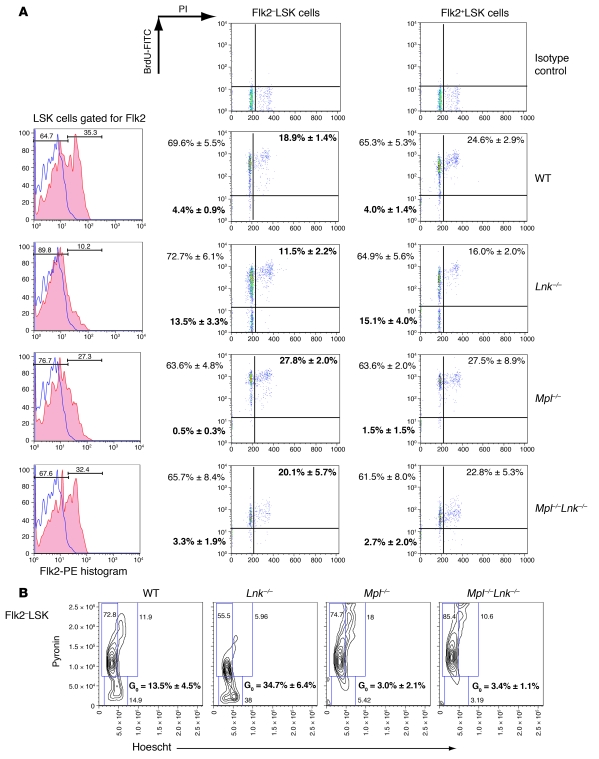
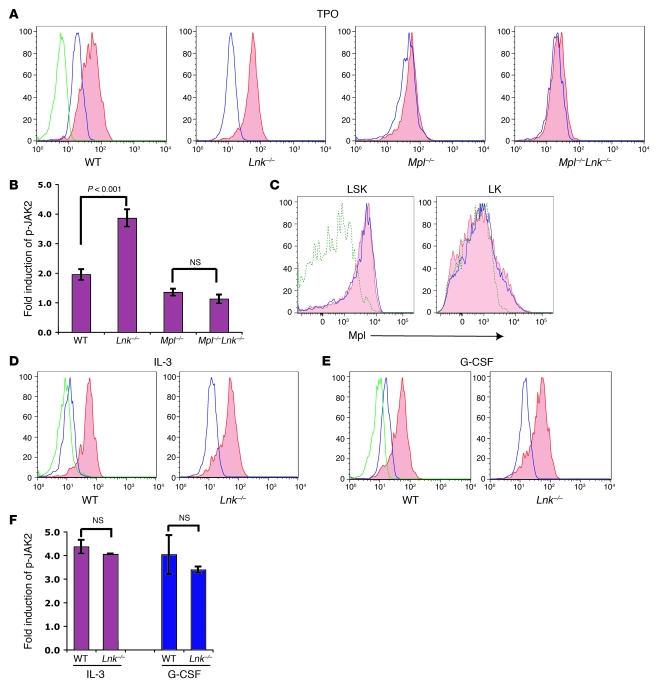
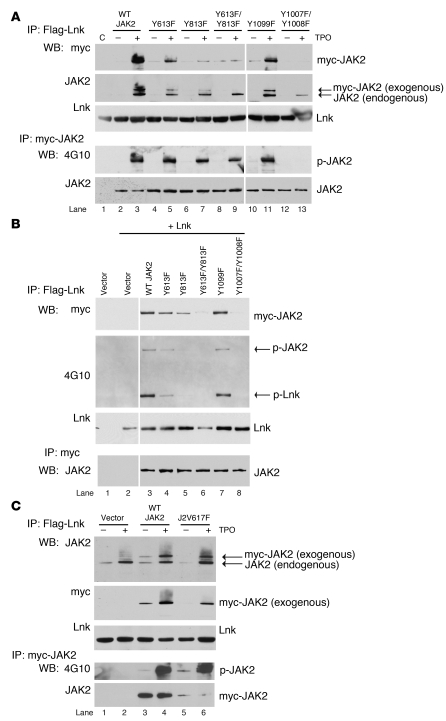
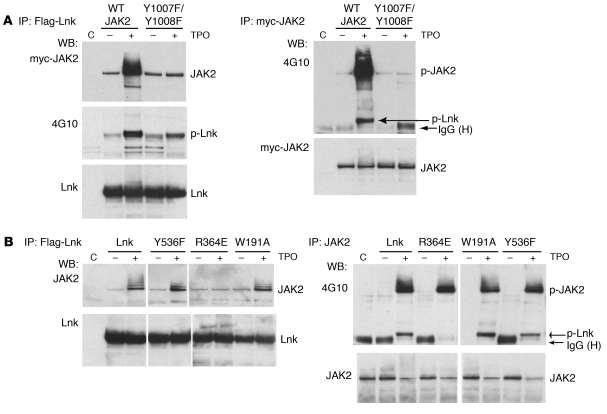
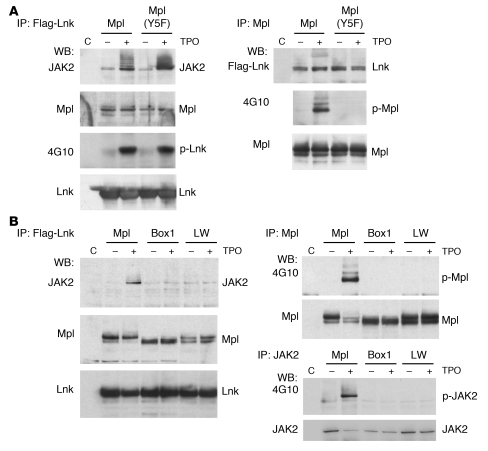
In addition to its role in megakaryocyte production, signaling initiated by thrombopoietin (TPO) activation of its receptor, myeloproliferative leukemia virus protooncogene (c-Mpl, or Mpl), controls HSC homeostasis and self-renewal. Under steady-state conditions, mice lacking the inhibitory adaptor protein Lnk harbor an expanded HSC pool with enhanced self-renewal. We found that HSCs from Lnk-/- mice have an increased quiescent fraction, decelerated cell cycle kinetics, and enhanced resistance to repeat treatments with cytoablative 5-fluorouracil in vivo compared with WT HSCs. We further provide genetic evidence demonstrating that Lnk controls HSC quiescence and self-renewal, predominantly through Mpl. Consistent with this observation, Lnk-/- HSCs displayed potentiated activation of JAK2 specifically in response to TPO. Biochemical experiments revealed that Lnk directly binds to phosphorylated tyrosine residues in JAK2 following TPO stimulation. Of note, the JAK2 V617F mutant, found at high frequencies in myeloproliferative diseases, retains the ability to bind Lnk. Therefore, we identified Lnk as a physiological negative regulator of JAK2 in stem cells and TPO/Mpl/JAK2/Lnk as a major regulatory pathway in controlling stem cell self-renewal and quiescence.


Figures

Figure 1
Figure 1. Mpl–/–Lnk–/– HSCs show decreased self-renewal ability.
(A) We quantified HSC frequencies of WT, Mpl–/–, Lnk–/–, and Mpl–/–Lnk–/– mice using limiting dilution cBMT. Results are pooled from 3–5 independent experiments. (B) Top: BM cells from WT, Mpl–/–, Lnk–/–, and Mpl–/–Lnk–/– mice were mixed at 1:1 ratio with CD45.1 competitor cells and transplanted into irradiated recipient mice. Chimerisms of transplanted mice were measured 1, 4, and 8 months after transplant (mean ± SD). n = 10. Middle panel: Transplant results from WT, Mpl–/–, and Mpl–/–Lnk–/– mice when mixed at 9:1 ratio with the competitors. Bottom: Transplant results from Lnk–/– BM cells when mixed at different ratios with the competitors. n = 5. *P < 0.005, WT compared with Mpl–/–Lnk–/– at the same time points, 2-tailed unequal variance t test; #P < 0.005, compared with same strain at 4 months, 2-tailed paired t test; **P < 0.05, compared with same strain at 4 months, 2-tailed paired t test. (C and D) Primary transplanted mice were sacrificed at 8 months and total BM cells were transplanted into secondary recipients. (C) Transplant results from WT, Mpl–/–, and Mpl–/–Lnk–/– mice when mixed at 9:1 ratio and Lnk–/– mice when mixed at 1:19 ratio with the competitors. (D) Transplant results from WT, Mpl–/–, and Mpl–/–Lnk–/– mice when mixed at 3:1 ratio and Lnk–/– mice when mixed at 1:99 ratio with the competitors. Chimerisms of the primary transplanted mice (mean ± SD) are shown in the left panels and those of the secondary transplant (mean ± SEM) are shown in the right panels. **P < 0.05; P = not significant, n = 5.
Figure 2
Figure 2. Lnk–/– LSK HSCs show decelerated cell cycle kinetics.
WT, Mpl–/–, Lnk–/–, and Mpl–/–Lnk–/– mice were fed with water containing BrdU for 7 days. Left panels show representative FACS plots of LinKithi BM cells gated for LSK and LK HSC progenitors. Numbers indicate percentage of cells within each boxed area. Bold numbers indicate that Lnk–/– and Mpl–/– mice were significantly different from WT mice. BrdU incorporation analysis in purified LSK (middle panels) and LK (right panels) cells were determined by FACS. Representative pseudocolor plots are shown. BrdU 2N, BrdU+ 2N, and BrdU+ populations with over 2N DNA content were quantified (mean ± SD). n = 4.
Figure 3
Figure 3. Lnk–/– HSCs have an increased quiescent HSC population compared with WT HSCs.
(A) WT, Mpl–/–, Lnk–/–, and Mpl–/–Lnk–/– mice were fed with water containing BrdU for 12 days. Left panels show representative FACS plots of LSK cells gated for Flk2 surface expression. The solid line indicates the reduction staining control, which contains all fluorochromes except Flk2-PE. Shaded areas indicate Flk2 antibody staining. Numbers indicate the percentage of cells represented by the solid line and shaded area. Bold numbers indicate that WT and Mpl–/– mice were significantly different from Lnk–/– mice. BrdU incorporation analysis in purified Flk2LSK (middle panels) and Flk2+LSK (right panels) HSCs were determined by FACS. Representative pseudocolor plots are shown (mean ± SD). n = 4. For middle and right columns, percentages indicate the percentage of cells gated in the respective quadrants. Bold numbers indicate that Lnk–/– and Mpl–/– mice were significantly different from WT mice. (B) Sorted Flk2LSK HSCs were stained with Py and Ho, and representative contour plots are shown. The quiescent G0 populations defined as PyHo are indicated (mean ± SEM). n = 4.
Figure 4
Figure 4. Lnk–/– HSCs showed potentiated activation of JAK2 in response to TPO, but not to IL-3 or G-CSF.
Purified LSK HSCs from mice of various genotypes were starved and stimulated with TPO (A and B) or IL-3 or G-CSF (DF) for 10 minutes. Representative histograms of the fluorescence intensity of phosphorylated JAK2 (p-JAK2; pY1007/Y1008) in response to TPO (A), IL-3 (D), or G-CSF (E) are shown. Green lines represent second antibody–only controls, blue solid lines represent lack of TPO stimulation, and shaded areas represent TPO stimulation. Quantifications of the fold inductions (mean ± SEM) of phosphorylated JAK2 TPO (B) or IL-3 or G-CSF (F) are shown (n = 3–8). (C) Representative histograms of Mpl surface expression in LSK (left) and LK (right) cells are shown. Green lines represent Mpl expression in Mpl–/– mice, blue lines represent WT mice, and shaded areas represent Lnk–/– mice.
Figure 7
Figure 7. Lnk binds to JAK2 Y613 and Y813 residues in response to TPO.
(A) We established stable 32D-B/A cell lines expressing Flag-Lnk and Mpl along with myc-tagged WT JAK2 or various JAK2 mutants. Cells were starved and stimulated with TPO. Top: IPs with Flag-specific antibodies and blots sequentially probed with antibodies specific for myc, JAK2, and Lnk. Bottom: IPs with myc-specific antibodies and blots sequentially probed with 4G10-specific and JAK2-specific antibodies. C, control 32D cells expressing Lnk alone. (B) Top: Flag-Lnk and either vector alone or various myc-JAK2 constructs were transiently transfected into 293T cells. Lysates were precipitated with Flag-specific antibodies and sequentially probed with antibodies specific for myc, 4G10, and Lnk. Bottom: Cell lysates were precipitated with myc-specific antibodies and probed with 4G10- or JAK2-specific antibodies. (C) Stable 32D-B/A cell lines expressing Flag-Lnk and Mpl, along with vector alone or myc-tagged WT JAK2 or JAK2 V617F (J2V617F) mutant were starved and stimulated with TPO. Top: IPs with Flag-specific antibodies and blots with antibodies specific for myc, JAK2, and Lnk. Bottom: IPs with myc-specific antibodies and blots with 4G10- and JAK2-specific antibodies.
Figure 5
Figure 5. The Lnk SH2 domain associates with kinase-active JAK2.
(A) Stable 32D-B/A cells expressing Mpl and Flag-tagged Lnk, in conjunction with either myc-tagged WT JAK2, or kinase-inactive JAK2 mutant Y1007F/Y1008F, were starved and stimulated with TPO for 10 minutes. Cell lysates were then precipitated with Flag-specific antibodies (left panel) and blotted with antibodies specific for myc (top), phosphotyrosine 4G10 (middle), or Lnk (bottom). The right panels show precipitation with myc-specific antibodies and blots with 4G10-specific (top) or myc-tagged antibodies (bottom). (B) We established stable 32D-B/A cell lines expressing Mpl along with Flag-tagged WT Lnk or various Lnk mutants with individual functional domains (R364E, W191A, and Y536F) abolished. Cells were starved and stimulated with TPO. Cell lysates were precipitated with Flag-specific antibodies (left panel) and blotted with antibodies specific for JAK2 (top) or Lnk (bottom). The right panels show precipitation with JAK2-specific antibodies and blots with antibodies specific for 4G10 (top) and JAK2 (bottom). C, control parental 32D-B/A cells; IgG(H), IgG heavy chain.
Figure 6
Figure 6. Lnk constitutively associates Mpl.
We established stable 32D-B/A cell lines expressing Flag-Lnk along with WT Mpl or various Mpl mutants. Cells were starved and then stimulated with TPO. (A) Left: Lysates from cells expressing either WT Mpl or the Y5F mutant were precipitated with Flag-specific antibodies and sequentially probed with antibodies specific for JAK2, Mpl, 4G10, and Lnk. Right: Cell lysates were also reciprocally precipitated with Mpl-specific antibodies and sequentially probed with antibodies specific for Flag, 4G10, and HA. (B) Left: Lysates from cells expressing WT Mpl or the Mpl mutants, Box1 or LW, were precipitated with Flag-specific antibodies and sequentially probed with antibodies specific for JAK2, Mpl, and Lnk. Right: Cell lysates were precipitated with Mpl-specific or JAK2-specific antibodies and probed with 4G10-specific antibodies, followed by antibodies specific for total Mpl and JAK2.

References

    1. Cheshier S.H., Morrison S.J., Liao X., Weissman I.L. In vivo proliferation and cell cycle kinetics of long-term self-renewing hematopoietic stem cells. Proc. Natl. Acad. Sci. U. S. A. 1999;96:3120–3125. doi: 10.1073/pnas.96.6.3120. - DOI - PMC - PubMed
    1. Passegue E., Wagers A.J., Giuriato S., Anderson W.C., Weissman I.L. Global analysis of proliferation and cell cycle gene expression in the regulation of hematopoietic stem and progenitor cell fates. J. Exp. Med. 2005;202:1599–1611. doi: 10.1084/jem.20050967. - DOI - PMC - PubMed
    1. Arai F., et al. Tie2/angiopoietin-1 signaling regulates hematopoietic stem cell quiescence in the bone marrow niche. Cell. 2004;118:149–161. doi: 10.1016/j.cell.2004.07.004. - DOI - PubMed
    1. Kiel M.J., Yilmaz O.H., Iwashita T., Terhorst C., Morrison S.J. SLAM family receptors distinguish hematopoietic stem and progenitor cells and reveal endothelial niches for stem cells. Cell. 2005;121:1109–1121. doi: 10.1016/j.cell.2005.05.026. - DOI - PubMed
    1. Wilson A., et al. c-Myc controls the balance between hematopoietic stem cell self-renewal and differentiation. Genes Dev. 2004;18:2747–2763. doi: 10.1101/gad.313104. - DOI - PMC - PubMed

Publication types

MeSH terms