Review
. 2008 Sep;130(3):421-34.
doi: 10.1007/s00418-008-0469-9. Epub 2008 Jul 11.

MALDI imaging mass spectrometry for direct tissue analysis: a new frontier for molecular histology

Affiliations
Review

MALDI imaging mass spectrometry for direct tissue analysis: a new frontier for molecular histology

Axel Walch et al. Histochem Cell Biol. 2008 Sep.

Abstract

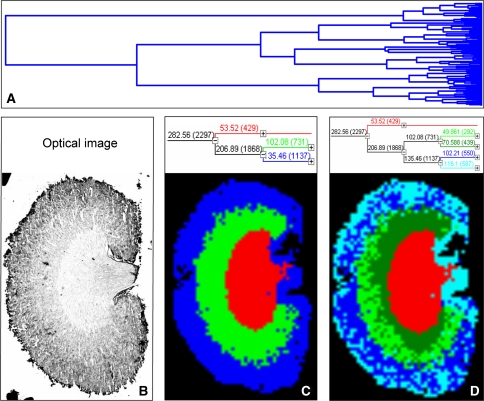
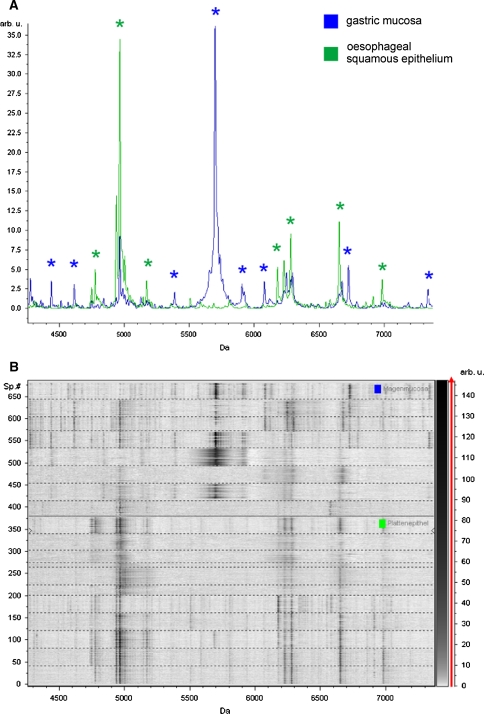
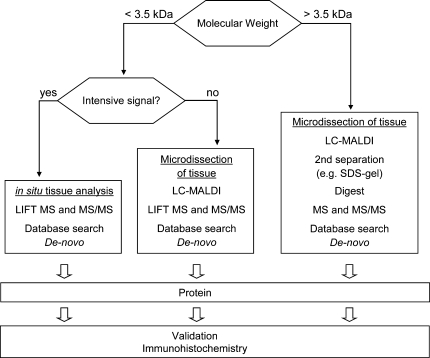
Matrix-assisted laser desorption/ionization (MALDI) imaging mass spectrometry (IMS) is a powerful tool for investigating the distribution of proteins and small molecules within biological systems through the in situ analysis of tissue sections. MALDI-IMS can determine the distribution of hundreds of unknown compounds in a single measurement and enables the acquisition of cellular expression profiles while maintaining the cellular and molecular integrity. In recent years, a great many advances in the practice of imaging mass spectrometry have taken place, making the technique more sensitive, robust, and ultimately useful. In this review, we focus on the current state of the art of MALDI-IMS, describe basic technological developments for MALDI-IMS of animal and human tissues, and discuss some recent applications in basic research and in clinical settings.


Figures

Fig. 1
Fig. 1
Integrity of histomorphology after MALDI measurement of tissue. a Frozen sample of a human pancreatic tissue on a cryostat steel plate. b Tissue section (10 μm) mounted onto a conductive glass slide for MALDI-IMS. c Tissue section after MALDI measurement: MALDI matrix was coated on the tissue section before measurement. d Subsequent to MALDI measurement the matrix is removed and the very same section is stained using standard H&E. e The histomorphology after MALDI-IMS is well-preserved as shown on higher magnification. Scale bars 4 mm (bd) and 400 μm (e)
Fig. 2
Fig. 2
Comparison of non-cancerous (exocrine pancreas) and cancerous (invasive ductal pancreatic cancer) tissue by MALDI-IMS. a Histological image of the tissue section after MALDI-IMS. b Selected mass species correlates with non-cancerous (m/z 14,836) tissue area. c Selected mass species correlates with cancerous (m/z 13,777) tissue area. d Average spectra in the mass range of 12–16.5 kDa obtained from the non-cancerous (green) and the cancerous (red) region displaying the two masses visualized in (b) and (c). e Corresponding Pseudo-Gel view of (d). Scanning resolution 160 μm. Scale bars 2 mm
Fig. 3
Fig. 3
MALDI-IMS of a tissue section of rat pituitary gland. a Optical microscopic image of a H&E stained tissues section. The staining was done after the MALDI measurement of the tissue section. bd Visualized selected m/z species representing features to pars distalis (m/z 6,651; green), pars intermedia (m/z 2,897; red) and pars neuralis (m/z 9,685; yellow). e Merge of ad. f MALDI-TOF MS spectra obtained from this case from pars distalis (green), pars intermedia (red) and pars neuralis (yellow) showing molecular differences between the histological regions. Scanning resolution 50 μm. Scale bars 1 mm
Fig. 4
Fig. 4
Mass species representing molecular features of preinvasive and invasive lesions of the breast. a Optical microscopic image of a H&E stained tissues section showing several carcinomata in situ regions (outlined in green). The staining was done after the MALDI measurement of the tissue section. This allows an unambiguous correlation with the MALDI imaging results. b Visualization of ion density images of two selected masses (m/z = 9,750 shown in yellow, m/z = 4,519 shown in blue) c Overlay of H&E staining and molecular image. The distribution of these two masses suggests a different clonal evolution of the preinvasive lesions. These two masses are also present in the invasive cancer cells surrounding some carcinomata in situ (right site). Scanning resolution 80 μm. Scale bars 1 mm
Fig. 5
Fig. 5
Hierarchical Clustering of a mouse kidney dataset achieved by MALDI-IMS. a Full dendrogram of all spectra in a mouse kidney dataset. b Optical image of the mouse kidney analysed by MALDI-IMS. c and d Reconstruction of selected dendrogram branches and corresponding images. The three main branches reflect the renal cortex (blue), medulla (green) and pelvis (red) c The medulla branch separates into two distinct areas, while cortex branch further differentiates into fat and connective tissue of the renal capsule and hylus and the actual cortex (d)
Fig. 6
Fig. 6
Histology directed MALDI-IMS profiling of gastric mucosa and esophageal squamous epithelium. a Overall average spectra in the mass range of 4.3–7.4 kDa obtained from eight cases of human gastric mucosa (blue) and eleven cases of esophageal squamous epithelium (green). b Virtual gel view of individual spectra displayed for mass range of 4.3–7.4 kDa. Statistical analysis revealed in this experiment 63 differentially expressed m/z species at significant levels
Fig. 7
Fig. 7
Workflow of protein identification

References

    1. {'text': '', 'ref_index': 1, 'ids': [{'type': 'DOI', 'value': '10.1021/cr990076h', 'is_inner': False, 'url': 'https://doi.org/10.1021/cr990076h'}, {'type': 'PubMed', 'value': '11712248', 'is_inner': True, 'url': 'https://pubmed.ncbi.nlm.nih.gov/11712248/'}]}
    2. Aebersold R, Goodlett DR (2001) Mass spectrometry in proteomics. Chem Rev 101(2):269–295 - PubMed
    1. {'text': '', 'ref_index': 1, 'ids': [{'type': 'DOI', 'value': '10.1021/ac051534r', 'is_inner': False, 'url': 'https://doi.org/10.1021/ac051534r'}, {'type': 'PubMed', 'value': '16448057', 'is_inner': True, 'url': 'https://pubmed.ncbi.nlm.nih.gov/16448057/'}]}
    2. Aerni HR, Cornett DS, Caprioli RM (2006) Automated acoustic matrix deposition for MALDI sample preparation. Anal Chem 78(3):827–834 - PubMed
    1. {'text': '', 'ref_index': 1, 'ids': [{'type': 'DOI', 'value': '10.1021/ac048329g', 'is_inner': False, 'url': 'https://doi.org/10.1021/ac048329g'}, {'type': 'PubMed', 'value': '15679338', 'is_inner': True, 'url': 'https://pubmed.ncbi.nlm.nih.gov/15679338/'}]}
    2. Altelaar AF, van Minnen J, Jiménez CR, Heeren RM, Piersma SR (2005) Direct molecular imaging of Lymnaea stagnalis nervous tissue at subcellular spatial resolution by mass spectrometry. Anal Chem 77(3):735–741 - PubMed
    1. {'text': '', 'ref_index': 1, 'ids': [{'type': 'DOI', 'value': '10.1021/ac0513111', 'is_inner': False, 'url': 'https://doi.org/10.1021/ac0513111'}, {'type': 'PubMed', 'value': '16448046', 'is_inner': True, 'url': 'https://pubmed.ncbi.nlm.nih.gov/16448046/'}]}
    2. Altelaar AF, Klinkert I, Jalink K, de Lange RP, Adan RA, Heeren RM, Piersma SR (2006) Gold-enhanced biomolecular surface imaging of cells and tissue by SIMS and MALDI mass spectrometry. Anal Chem 78(3):734–742 - PubMed
    1. {'text': '', 'ref_index': 1, 'ids': [{'type': 'DOI', 'value': '10.1038/nprot.2007.117', 'is_inner': False, 'url': 'https://doi.org/10.1038/nprot.2007.117'}, {'type': 'PubMed', 'value': '17546014', 'is_inner': True, 'url': 'https://pubmed.ncbi.nlm.nih.gov/17546014/'}]}
    2. Altelaar AF, Luxembourg SL, McDonnell LA, Piersma SR, Heeren RM (2007) Imaging mass spectrometry at cellular length scales. Nat Protoc 2(5):1185–1196 - PubMed

LinkOut - more resources