. 2008 Nov 15;56(15):1691-709.
doi: 10.1002/glia.20721.

A new in vitro model of the glial scar inhibits axon growth

Affiliations

A new in vitro model of the glial scar inhibits axon growth

Ina B Wanner et al. Glia. .

Abstract

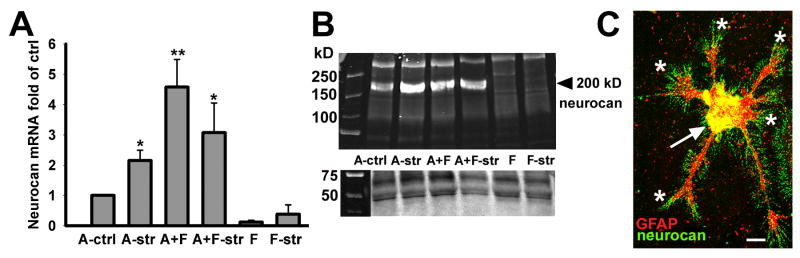
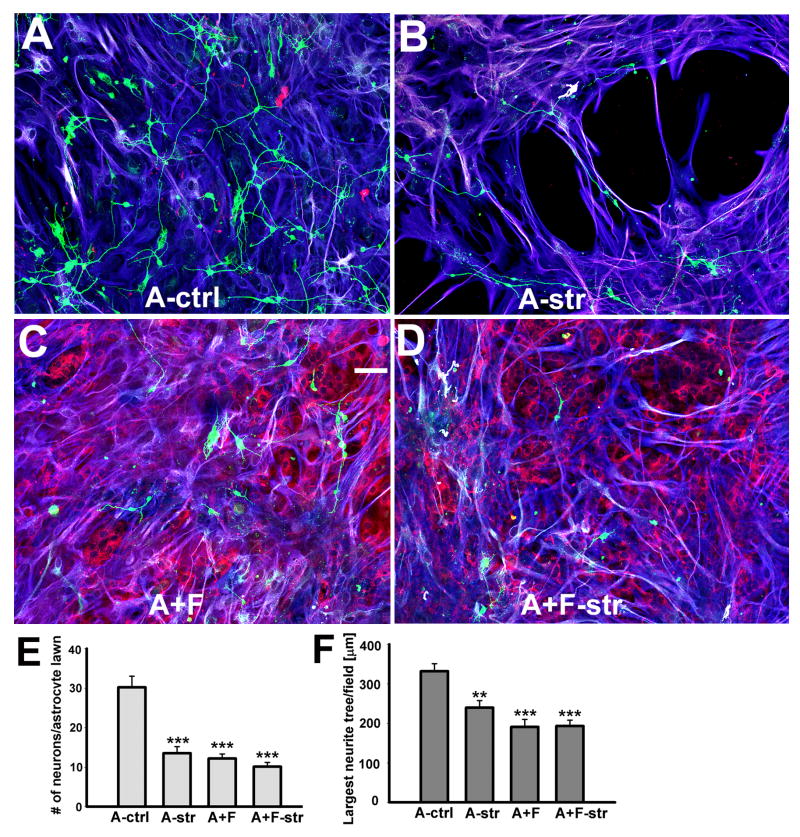
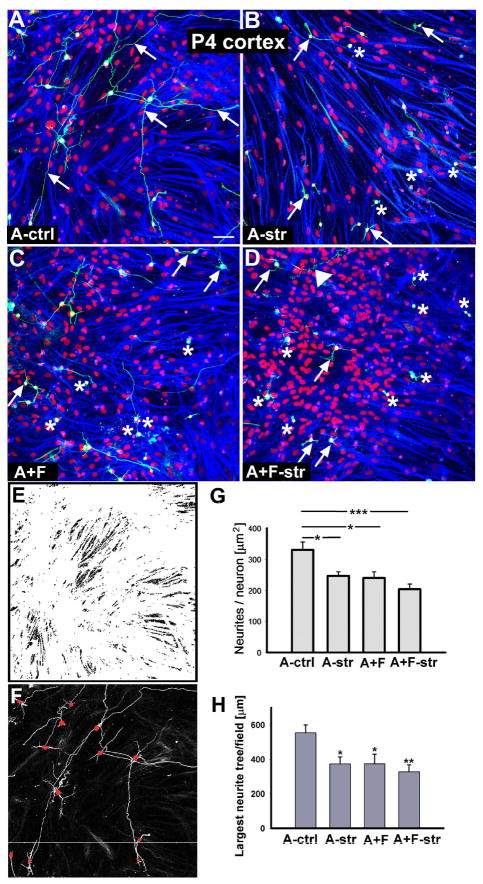
Astrocytes respond to central nervous system (CNS) injury with reactive astrogliosis and participate in the formation of the glial scar, an inhibitory barrier for axonal regeneration. Little is known about the injury-induced mechanisms underlying astrocyte reactivity and subsequent development of an axon-inhibitory scar. We combined two key aspects of CNS injury, mechanical trauma and co-culture with meningeal cells, to produce an in vitro model of the scar from cultures of highly differentiated astrocytes. Our model displayed widespread morphological signs of astrocyte reactivity, increases in expression of glial fibrillary acidic protein (GFAP), and accumulation of GFAP in astrocytic processes. Expression levels of scar-associated markers, phosphacan, neurocan, and tenascins, were also increased. Importantly, neurite growth from various CNS neuronal populations was significantly reduced when neurons were seeded on the scar-like cultures, compared with growth on cultures of mature astrocytes. Quantification of neurite growth parameters on the scar model demonstrated significant reductions in neuronal adhesion and neurite lengths. Interestingly, neurite outgrowth of postnatal neurons was reduced to a greater extent than that of embryonic neurons, and outgrowth inhibition varied among neuronal populations. Scar-like reactive sites and neurite-inhibitory patches were found throughout these cultures, creating a patchwork of growth-inhibitory areas mimicking a CNS injury site. Thus, our model showed relevant aspects of scar formation and produced widespread inhibition of axonal regeneration; it should be useful both for examining mechanisms underlying scar formation and to assess various treatments for their potential to improve regeneration after CNS injury. (c) 2008 Wiley-Liss, Inc.


Figures

Figure 1
Figure 1. Mechanical stretch induces astrocyte stellation, clustering and GFAP accumulation
A) Astrocytes on collagen coated silastic membranes were differentiated but were weakly stained for GFAP (blue) and S100 (green). B) Stretching of astrocytes (A-str) induced a stellate morphology (arrows) and increased GFAP and S100 signals (turquoise). Scale bar = 20 μm. C-F). Fluorescence signal intensities were emphasized using a scale showing cell free spaces in blue and saturated GFAP signals in red (see Methods). C) Control astrocytes had homogeneous GFAP immunofluorescence across the cell lawn, despite possessing long processes (A-ctrl). D) Stretching of astrocytes induced cell clustering (increased blue space) and increased GFAP signals in stellate processes (red). Scale bar = 50 μm. E) Stretching was accompanied by a 5.6-fold increase in cell-free space (N=4; P=0.0001). F) Stretching led to a 3-fold increase in peak GFAP area (N=4; P=0.0005). Error bars represent standard error of the means (SEM).
Figure 2
Figure 2. Meningeal fibroblast causes astrocyte reactivity and increased GFAP expression
A) Astrocytes (A-ctrl) on plastic were flat, round or oval-shaped cells. GFAP immunoreactivity was largely perinuclear. Fibronectin immunoreactivity was weak and rarely on cells. In A-E, GFAP=green; fibronectin=red; Nuclei=blue. B) In long-term astrocyte-fibroblast cocultures (A+F), spindle-shaped astrocytes with elongated processes surrounded clusters of meningeal fibroblasts; astrocyte processes entered fibroblast territory (arrows). Astrocytes contacting fibroblasts had brighter GFAP staining. C) 2 day coculture of astrocytes and fibroblasts. “Reactive sites” contained elongated and strongly GFAP-positive astrocytes (arrows) on and around patches of fibroblasts. D) Process-bearing differentiated astrocytes on collagen-coated silastic membranes. No fibronectin-positive cells are seen. E) Astrocyte-fibroblast coculture 3 days after fibroblast addition and 24 hr after stretching (A+F-str) shows a disrupted lawn, with clusters of stellate astrocytes forming “bridges” of fasciculated processes across spaces (asterisks). Increased GFAP signals were found accumulated in stellate processes that were fibronectin-positive (yellow). Fibronectin-positive fibroblasts (asterisks) remained evenly distributed after stretching. Scale bars = 20 μm. F) Real time PCR of GFAP mRNA (mean ± SEM, N=6) in controls (A-ctrl), stretched astrocytes (A-str), astrocyte-fibroblast cocultures (A+F) and stretched astrocyte-fibroblast cocultures (A+F-str). A trend was seen towards increased GFAP mRNA with stretch. GFAP mRNA increased 2.5 fold over controls in A+F cocultures (p<0.001, N=6) and 1.7 fold in stretched cocultures (p<0.05). G) GFAP protein levels in cell lysates were adjusted for the percentage of astrocytes (mean ± SEM, N=3; see Methods). GFAP levels did not change significantly with stretch, but increased 2.9 fold in A+F cocultures (p<0.0001) and 2.5 fold in A+F-str cocultures (p< 0.001).
Figure 3
Figure 3. Phosphacan expression is increased by meningeal fibroblast addition
A) Western blots of CM from each of the different culture conditions were probed with anti-phosphacan (2B49). Phosphacan was detected as a broad band between 170 kD and 240 kD; longer exposure revealed bands near 117 kD and 400 kD (not shown). Both stretching (A-str) and coculture with fibroblasts (A+F, A+F-str) increased phosphacan levels. Secreted phosphacan was not detected in fibroblasts cultured alone in FBS (F). B) Real-time PCR (mean ± standard deviation, SD; N=4 demonstrated a 2.6 fold increase in phosphacan mRNA in A+F cocultures (p<0.01), with trends toward increases in A-str and A+F-str. Phosphacan expression was negligible in both unstretched and stretched meningeal fibroblasts (F, F-str). C) Astrocytes on collagen-coated silastic membranes expressed patchy cytoplasmic phosphacan signals (antibody 3F8), with no staining in distal processes (arrows, inset). D) One day after stretching astrocytes formed an interrupted lawn with clusters of strongly phosphacan-reactive astrocytes; particularly intense signals were seen in stellate processes (arrows). Scale bar =100 μm, main images; 20 μm, insets.
Figure 4
Figure 4. Neurocan expression is increased by stretch and meningeal fibroblast addition
A) Real time PCR for neurocan mRNA normalized to GAPDH mRNA (mean ± SD; N=4). Neurocan mRNA was increased ca. 2-fold by stretch (p<0.05), and greatly increased by fibroblast addition, with or without stretching (5.6 fold in A+F, p<0.01, Tukey; 3.2 fold in A+F-str, p<0.05, Bonferroni). Meningeal fibroblast samples, unstretched and stretched, had negligible amounts of neurocan mRNA (not shown). B) A Neurocan band at 150-180 kD increased in stretched astrocytes (A-str) and in astrocyte-fibroblast cocultures (A+F, A+F-str). Coomassie staining of the gel shows protein loading. Neurocan was not detected at this MW in either unstretched or stretched fibroblast cultures (F, F-str). C) Confocal image of an astrocyte in a stretched culture on collagen immunostained with anti-neurocan 3F6 (green) and anti-GFAP (red). The stellate astrocyte shows patchy deposits of neurocan immunoreactivity over the cell body (yellow, arrow) and neurocan puncta along endings of reactive astrocyte processes (asterisks). Bar = 10 μm.
Figure 5
Figure 5. Stretch and fibroblast addition lead to increased tenascin expression in astrocytes
A) Non-saturating PCR shows increases in tenascin C and tenascin R mRNAs in stretched astrocytes on collagen, while GAPDH levels do not change. B) Real time PCR demonstrated a 2.3-fold increase in tenascin R expression in A+F cocultures (mean ± SD; N=5; p<0.05). Trends toward increases in stretched cultures were not significant, presumably due to high variability. Meningeal fibroblasts showed much lower tenascin R mRNA signals (F, F-str, N=4). C) Blot of CM probed with anti-chick tenascin (recognizing tenascin C, likely crossreacting with tenascin R). Tenascin levels increased in stretched (A-str) and astrocyte-fibroblast cocultures (A+F, A+F-str). Coomassie staining (blue) shows equal protein loading. D) Tenascin signals in CM from stretched and unstretched astrocytes are stronger than for similarly treated fibroblasts (F, F-str). Lower image shows similar protein loading. E) Confocal fluorescent micrographs (flat projections of image stacks) show weak tenascin signals (green) on control GFAP-positive astrocytes (A-ctrl) immunostained with anti-chick tenascin (green) and GFAP (red). F) Stretched astrocyte-fibroblast cocultures (A+F-str) had clusters of hypertrophied GFAP-positive cells with intense tenascin-reactive puncta in the perinuclear cytoplasm, on cell surfaces (arrows), and on processes (asterisk). Tenascin and GFAP signals were stronger in reactive areas of cocultures (not shown). Bar = 20 μm.
Figure 6
Figure 6. Stretch-reactive astrocytes inhibit outgrowth from DRG and cortical explants
A) E15 DRGs were explanted for 24 hr onto collagen-coated silastic membranes. A broad net of extensively branching neurofilament-positive (SMI31) neurites grew from the explant. B) Explants placed on stretched astrocytes had less outgrowth, stopping within 200 μm (curved bracket) or turning (asterisk). C) Embryonic cortical explants on control astrocytes. β3 tubulin-positive neurites grew robustly and formed fascicles on astrocytes. D) On stretched astrocytes, cortical explants showed less neurite outgrowth and thinner fascicles. Explant centers are not shown in these confocal slices. D, debris. Bar = 50 μm.
Figure 7
Figure 7. Neurite growth inhibition of dissociated DRG neurons on scar-like astrocytes
A-C) Dissociated embryonic DRG neurons grown 24 hr on collagen-coated membranes. Cultures were stained for GFAP (blue), fibronectin (red) and β3 tubulin (green). A) Stellate, highly GFAP-reactive astrocytes intermingled with fibronectin-positive fibroblasts in reactive sites. Neurites from embryonic DRG neurons grew sparsely in these areas compared to vigorous outgrowth on control astrocytes (not shown, see Fig. 6A). Neurites often stopped or had abrupt turns or loops (asterisks) or thickened endings (arrows) at borders with astrocyte-free zones. Bar = 50 μm. B) Thickened endings display a convex shape like that of retraction bulbs (arrows). C) Neurite with 3 branches bearing swollen end bulbs (asterisks) and a main process ending in a growth cone with filopodia contacting an elongated astrocyte process (arrow). Scale bar in B, C = 25 μm. D) Purified DRG neurons matured in vitro. Both small (left) and large (right) diameter neurons adhered and grew branched neurites on control astrocytes. Small neurons had the most elaborate neurites (left). E) Only smaller diameter DRG neurons adhered and grew neurites on stretched astrocyte-fibroblast cocultures (A+F-str). Many neurons lacked processes or had short neurites with few branches. The average neurite growth was markedly reduced on stretched astrocyte-fibroblast cocultures compared to controls. Bar = 25 μm.
Figure 8
Figure 8. Reduced adhesion and neurite outgrowth of embryonic spinal neurons on the scar models
Embryonic spinal cord cells cultured at low density for 24 hr on collagen grown astrocytes. Cultures were stained for GFAP (blue), fibronectin (red), and β3 tubulin (green). A) The majority of neurons grew neurites on control astrocytes. B) Markedly fewer neurons attached to stretched astrocytes (A-str). Neurites were almost exclusively on astrocyte surfaces, even at “reactive sites” showing stellate astrocytes with strong GFAP staining and some fibronectin staining (purple-white). C) Astrocyte-fibroblast cocultures (A+F) also had fewer neurons, and many neurons had no or only short neurites. D) Stretched astrocyte-fibroblast cocultures (A+F-str) had “reactive sites” with astrocyte spaces populated by fibronectin-positive fibroblasts. Only a few neurons attached and these had short neurites or failed to grow. Scale bar = 50 μm. E-F) Neuron density and neurite outgrowth of embryonic spinal neurons on treated and control astrocytes. E) Mean neuron numbers (± SEM) normalized to astrocyte area are plotted (see Methods). Neuron densities were significantly reduced in all three scar-like conditions (N=4). F) The average length of the longest neurite tree per image decreased by 27% in stretched cultures (p<0.01) and by 42% in astrocyte-fibroblast-cocultures (stretched and unstretched) (p<0.001, N=4, Tukey).
Figure 9
Figure 9. Strong inhibition of neurite outgrowth from postnatal spinal neurons on the scar models
A) Postnatal (P4) spinal cord neurons grown for 24 hr on control astrocytes on fibronectin (A-ctrl); cultures were stained for DAPI (nuclei, red), β3 tubulin (neurons, green), and GFAP (astrocytes, blue). Neurons had comparatively long and straight processes. B) Similar numbers of neurons adhered to stretched astrocyte-fibroblast cocultures (A+F-str), but many had only short, thin or no neurites (see Table I). C) Some neurons on control astrocytes had very long processes (> 650 μm). D) Two neurons on stretched astrocyte-fibroblast cocultures display numerous processes with swollen end balls (asterisks). E) A group of neurons on stretched astrocyte-fibroblast cocultures displays short processes that turn 180° or show thickened endings (arrows). Bars = 20 μm. F) Largest neurite trees per field are plotted for all conditions. Neurite trees were significantly shorter on all treated lawns compared with controls (Neurolucida tracing; ** = p<0.01; *** = p<0.001, Tukey). G) The same set of images was analyzed in an automated fashion (see Fig. 10). Neurite growth per neuron decreased to one third of controls in each of the scar-like conditions (mean ± SEM ; p< 0.001, Tukey).
Figure 10
Figure 10. Strong inhibition of postnatal cortical neuron outgrowth on the scar models
A-D) P4 cortical neurons grown 24 hr on scar models (on fibronectin) stained for β3 tubulin (green), GFAP (blue), and nuclei (red). A) Neurons grew long neurites (arrows) over control astrocytes. B) Neurons often had short processes (arrows) or failed to grow processes (asterisks) on stretched astrocytes. C) Neurons also had short neurites (arrows) in astrocyte-fibroblast cocultures. D) Neurite growth was greatly reduced on stretched astrocyte-fibroblast cocultures. Neurites were short (arrows), beaded (arrowhead), or failed to grow (asterisks). Scale bar = 50 μm. E) For semi-automated analysis, a binary mask of GFAP levels above threshold (white) was derived from the image shown in (A) to limit the analysis to neurites growing on astrocyte-covered culture surfaces. F) Neurons (red dots) were identified based on double labeling of DAPI with β3 tubulin fluorescence and appropriate size criteria (see Methods) and non-neuronal cells were excluded. White tracings are neurites defined by the program based on thickness and connection with perikarya (see Methods). G) Somata and neurites were quantified using 24 images per condition. An estimate of the average total neurite length was obtained by dividing neurite pixels (white lines in F) by the calculated neuron number (red areas in F divided by an average soma size) for each image. Significant reductions in growth were found with all treatment groups (** = P<0.01; *** = P< 0.001). H) Similar data were obtained by individually tracing the same set of neurons using Neurolucida. The largest neurite trees per field were significantly shorter on treated cultures compared to controls (mean ± SEM; * = P<0.05; ** = P<0.01, Tukey).

References

    1. Abnet K, Fawcett JW, Dunnett SB. Interactions between meningeal cells and astrocytes in vivo and in vitro. Brain Res Dev Brain Res. 1991;59(2):187–96. - PubMed
    1. Ahmed SM, Rzigalinski BA, Willoughby KA, Sitterding HA, Ellis EF. Stretch-induced injury alters mitochondrial membrane potential and cellular ATP in cultured astrocytes and neurons. J Neurochem. 2000;74(5):1951–60. - PubMed
    1. Ard MD, Schachner M, Rapp JT, Faissner A. Growth and degeneration of axons on astrocyte surfaces: effects on extracellular matrix and on later axonal growth. Glia. 1993;9(4):248–59. - PubMed
    1. Asher RA, Morgenstern DA, Fidler PS, Adcock KH, Oohira A, Braistead JE, Levine JM, Margolis RU, Rogers JH, Fawcett JW. Neurocan is upregulated in injured brain and in cytokine-treated astrocytes. J Neurosci. 2000;20(7):2427–38. - PMC - PubMed
    1. Asher RA, Morgenstern DA, Moon LD, Fawcett JW. Chondroitin sulphate proteoglycans: inhibitory components of the glial scar. Prog Brain Res. 2001;132:611–9. - PubMed

Publication types

MeSH terms